


Introduction
Uremic toxins with size greater than 500 Da or less than 60 kDa are classified as middle molecules. β2-Microglobulin (β2MG), with a molecular weight of approximately 11 kDa, is a surrogate marker for clearance of middle molecules in patients with end-stage renal disease (ESRD) [1,2]. Middle molecules are associated with development of uremic symptoms and contribute to disease progression of chronic kidney disease (CKD) and development of cardiovascular complications in patients with ESRD. Practically, the strong association between plasma level of β2MG and renal function was confirmed, and strong associations between various larger middle molecules, such as tumor necrosis factor alpha (TNF-α) and interleukins (ILs), and unfavorable outcomes including cardiovascular complications were confirmed [2–4]. Introduction of a high-flux (HF) dialyzer and dialytic modality, such as hemodiafiltration (HDF), prominently increased the clearance of middle molecules such as β2MG. However, larger middle molecules with molecular weights greater than that of β2MG could not be easily removed through a conventional HF dialyzer or HDF [3]. Although the clinical effect of such molecules on uremic toxicity is not proven, larger middle molecules are important in development of cardiovascular complications, particularly in CKD patients [5,6]. In detail, middle molecules, including larger middle molecules, are associated with various pathological conditions such as endothelial dysfunction, oxidative stress, and inflammation. The probable association between middle molecules and pathological conditions has led to development of the innovative medium cut-off (MCO) membrane [6].
Compared to a conventional HF membrane, the MCO membrane is characterized by larger, more consistent pore size and a narrower inner diameter of hollow fibers. Theoretically, the innovative structure of the MCO membrane can remove larger middle molecules that cannot be easily removed using the HF dialyzer or HDF [6,7]. To date, several clinical studies regarding the MCO membrane have been conducted. However, there are few long-term studies regarding change in plasma levels of larger middle molecules using the MCO membrane. Moreover, most clinical studies have focused on the clinical effects of the MCO membrane for only larger middle molecules, such as proinflammatory cytokines (TNF-α and ILs) and kappa or lambda free light chains (κFLC or λFLC) [6–9]. Additionally, cardiovascular changes in patients with ESRD undergoing maintenance hemodialysis (HD) mainly present with fluid overload, uremic cardiomyopathy, and ischemic heart disease; these clinical changes are associated with secondary hyperparathyroidism, anemia, inter-dialytic weight gain, and uremic toxin accumulation. Generally, cardiovascular complications are common in ESRD, and a strong independent association between CKD and cardiovascular complications has been confirmed [10,11]. Specifically, sclerostin is secreted by osteocyte and reduces differentiation and activity of osteoblasts, and its presence is associated with cardiovascular calcifications regardless of CKD existence [12–14]. In addition, sclerostin level in CKD patients with vascular calcifications is higher than in patients with only vascular calcifications [15,16]. However, the function of the sclerostin association with vascular calcification remains unclear [17]. In this regard, it is clinically important to assess changes in plasma sclerostin level and associations between sclerostin and other parameters after long-term use of the MCO dialyzer in HD patients. And, the more definite function of the sclerostin associated with cardiovascular complications including vascular calcification in HD patients can suggest. Other than sclerostin, larger middle molecules such as growth differentiation factor 15 (GDF15, 16.7 kDa), leptin (16 kDa), and fibroblast growth factor 23 (FGF23, 22.5 kDa) are well-known independent cardiovascular risk factors in dialytic patients [18–20]. Thus, an analysis to quantify the plasma concentration changes of larger middle molecules, such as sclerostin, GDF15, leptin, and FGF23; small solutes; and various additional parameters in response to long-term application may identify the impact of HD using the MCO dialyzer on cardiovascular complications in dialytic patients.
Methods
Experimental design
This study was a prospective, observational study conducted over 12 months in Wonkwang University Hospital, Iksan, Republic of Korea, to investigate the efficacy of a new dialyzer for larger middle molecules such as GDF15, leptin, sclerostin, FGF23, retinol-binding protein 4 (RBP4), and β2MG in patients with ESRD. The study was conducted with approval of the Institutional Review Board of Wonkwang University Hospital (No. 2019-07-005-002) according to the Declaration of Helsinki guidelines. All participating patients provided written informed consent prior to the beginning of the study. First, the enrolled patients were divided into two groups (the Theranova group [the MCO membrane group] and the control group). Patients in the MCO group met all of the following conditions: sustained HD using the HF membrane in the past 3 months, underwent maintenance HD 2 or 3 times per week, and 19 to 70 years old without cardiovascular complications including myocardial infarction, heart failure, arrhythmias, angina pectoris, and peripheral arterial diseases within the past 3 months. Additionally, patients in the MCO group met at least one of the following conditions: serum albumin ≥ 3.5 g/dL at baseline; uncontrolled serum phosphorus despite intensive use of phosphate-lowering agents during the past 3 months (serum calcium × phosphate > 55); uncontrolled secondary hyperparathyroidism despite intensive use of vitamin D analogs or calcimimetics (serum parathyroid hormone (PTH) > 300 pg/mL on two consecutive examinations with a 3-month interval while using vitamin D analogs or calcimimetics); and severe pruritus despite intensive medical therapy. Additionally, patients in the control group were randomly selected from patients who met the first three criteria. The exclusion criteria for this study population were CKD patients undergoing HD and who had psychiatric disorder or severe chronic disease such as advanced chronic obstructive pulmonary disease requiring home oxygen, severe heart failure, uncontrolled diabetes, or advanced liver cirrhosis.
Use of phosphate-lowering agents and PTH-lowering agents
The enrolled patients received phosphate-lowering agents or PTH-lowering agents according to levels of serum phosphate, calcium, and PTH at a 1-month (serum phosphate and calcium) or 3-month interval (serum PTH). We mainly used medications of calcium acetate (710 mg, tablet), sevelamer carbonate (800 mg, tablet), calcitriol (0.25 μg, capsule), and cinacalcet (25 mg, tablet). We increased dosage or changed medications according to levels of serum phosphate, calcium, and PTH. If the dialytic patients showed hyperphosphatemia (>4.5 mg/dL), we initially prescribed 2 to 3 calcium acetate tablets per day. If serum calcium × phosphate > 55 or hypocalcemia was persistent despite increased dose (up to six tablets per day) of calcium acetate, we administered sevelamer carbonate. Furthermore, when serum PTH level was >300 pg/mL, we prescribed 1 to 2 capsules of calcitriol per day. If serum PTH level remained >300 pg/mL despite use of calcitriol, we added cinacalcet (1 tablet per day) and changed the dosage according to serum calcium and PTH levels at a 3-week interval.
Dialyzers and techniques
HD in the control group was performed using the HF membrane (Polyflux 140H; Baxter, Deerfield, IL, USA), whereas HD in the MCO group was performed using the MCO membrane (MCO 400; Baxter). All enrolled patients underwent HD using the HF membrane (Polyflux 140H) before beginning this study. The manufacturer specifications of the above dialyzers are as follows: MCO 400 (MCO membrane, polyarylethersulfone-polyvinylpyrrolidone; inner diameter: 180 μm, wall thickness: 35 μm, and effective membrane area: 1.7 m2) and Polyflux 140H (HF membrane, polyarylethersulfone; inner diameter: 200 μm, wall thickness: 50 μm, and effective membrane area: 1.4 m2).
Measurement of serological biomarkers
In this study, blood samples were collected at 3-month or 6-month intervals. For measurement of plasma levels of GDF15 (16.7 kDa), leptin (16 kDa), sclerostin (22.5 kDa), FGF23 (22.5 kDa), RBP4 (21 kDa), and β2MG (11 kDa), blood samples of enrolled patients were drawn prior to each dialysis session at 6-month intervals, centrifuged according to standard guidelines, and stored at –80°C until final analysis. Other serological markers including hemoglobin (Hb), total protein, albumin, calcium, phosphate, C-reactive protein (CRP, 23 kDa), and PTH were measured by standard laboratory techniques prior to dialysis at 3-month intervals. Moreover, blood samples were drawn just before and after the midweek dialysis session at 12 months to evaluate the reduction ratio (RR) per dialytic session for the biomarkers GDF15, leptin, sclerostin, FGF23, RBP4, β2MG, calcium, phosphate, and CRP. Furthermore, the blood samples were centrifuged according to standard guidelines and stored at –80°C until their final analysis. The plasma levels of GDF15, leptin, sclerostin, FGF23, RBP4, and β2MG were measured by the Luminex 200 System (Luminex, Austin, TX, USA) using the Human Magnetic Luminex Assay Kit (R&D Systems, Minneapolis, MN, USA).
Calculation of reduction ratios
We collected blood samples prior to and after one HD session 12 months after application of MCO or HF dialyzer to calculate the RR of several biomarkers. The RRs of small molecules and middle molecules including larger middle molecules were calculated using the following formula: RR (%) = {1 – (Cpost/Cpre)} × 100, where the predialysis concentration (Cpre) and postdialysis concentration (Cpost) are measured plasma concentrations of the small and middle molecules prior to and after one HD session, respectively. Specifically, to compensate the hemoconcentration after one session of dialysis, the values of Cpost for all molecules were corrected using a single-compartment kinetic model using the following formula: corrected Cpost = Cpost /{1 + (BWpre – BWpost)/0.2 × BWpost},where BWpre and BWpost are body weight prior to and after one HD session, respectively [21].
Measurement of body composition index and dialysis adequacy
Body composition monitoring in dialytic patients was performed using multi-frequency electrical bio-impedance (Body Composition Monitor, Fresenius Medical Care, Bad Homburg, Germany). The lean tissue index (LTI), fat tissue index (FTI), and relative overhydration (OH%) were measured at 3-month intervals prior to dialysis sessions for all enrolled patients. The values of single-pool Kt/V (spKt/V) were calculated at 3-month intervals to determine dialysis adequacy. The spKt/V values were calculated using the following formula, which is described and modified by Daugirads: spKt/V = –Ln (R – 0.008 × t) + (4 – 3.5 × R) × UF/W, where t is the session length (in hours), R is the ratio of postdialysis to predialysis serum urea nitrogen, UF is the volume of fluid removed during dialysis (in liters), V is the postdialysis urea distribution volume (in liters), and W is the postdialysis body weight [22].
Calculations of normalized protein catabolic rate
We calculated the normalized protein catabolic rate (nPCR) in all patients at 3, 6, 9, and 12 months after dialysis. The nPCR values are presented as grams of protein per kilogram of body weight per day (g/kg per day) and estimated using the following formula: nPCR = (0.0136 × {Kt/V × ([pre-blood urea nitrogen (BUN) + post-BUN]/2)}) + 0.251 (BUN, midweek averaged BUN) [23]. Generally, the nPCR is used as a method to evaluate protein intake in dialytic patients [24,25]. The levels of serum albumin and LTI can be influenced by daily protein intake and nutritional status, particularly in dialytic patients. Thus, we calculated the nPCR at 3, 6, 9, and 12 months to perform precise evaluation of the effect of the MCO membrane on serum albumin loss or change in LTI value.
Statistical analysis
The level of significance was set to 0.05, and two-tailed comparisons were performed. The differences in baseline characteristics between the two groups were evaluated using independent two-sample t tests or Wilcoxon rank sum tests for continuous variables and chi-square tests or Fisher exact tests for categorical variables. Analysis of covariance was employed to evaluate the differences in outcome measures between the groups. Paired-sample t tests or Wilcoxon signed-rank tests were conducted to analyze changes in outcome within each group at each visit compared to baseline. Additionally, we performed Pearson correlation analysis to identify the association between changes of large middle molecules and changes of other molecules or index. Fisher exact tests were used for a comparative analysis of incidence of cardiovascular adverse events and mortality during the study period between the two groups. Statistical analyses were performed using R statistical software version 3.5.2 (R Foundation for Statistical Computing, Vienna, Austria; http://www.r-project.org).
Results
Characteristics at baseline
A total of 34 patients was divided into two groups in this study: the control group comprising 18 patients who underwent maintenance dialysis using the HF dialyzer and the MCO group comprising 16 patients who underwent maintenance dialysis using the MCO dialyzer. Three patients in the MCO group initially showed clinical features of tertiary hyperparathyroidism. This is possibly because patients who had poorly controlled serum phosphorus or secondary hyperparathyroidism were categorized into the MCO group at initial enrollment. We performed basal and follow-up analyses for several biomarkers in 16 patients who did not show tertiary hyperparathyroidism. The baseline characteristics of the 34 patients are shown in Table 1. The mean ± standard deviation (SD) age of patients in the MCO group was 47.88 ± 12.03 years, significantly lower than that of the control group. The values of serum albumin and phosphorus in the MCO group also were significantly higher than those of the control group (serum phosphate: 4.82 ± 1.46 vs. 6.31 ± 2.20, p = 0.030 and serum albumin: 3.80 ± 0.22 vs. 4.07 ± 0.28, p = 0.004). The values of OH% in the MCO group were significantly lower than those of the control group (10.26 ± 11.22 vs. 17.63 ± 9.21, p = 0.030). Males were predominant in both groups. HD vintage, dialytic frequency, prevalence of diabetes mellitus, and hypertension did not show a significant difference between the two groups. Moreover, body composition indexes of FTI, LTI, Hb, total protein, spKt/V, CRP, and PTH levels did not differ between the two groups. The plasma levels of larger middle molecules and β2MG at baseline were not significantly different between the two groups (Table 1).
Changes of several biomarkers including small solutes and serum albumin during 12-month treatments
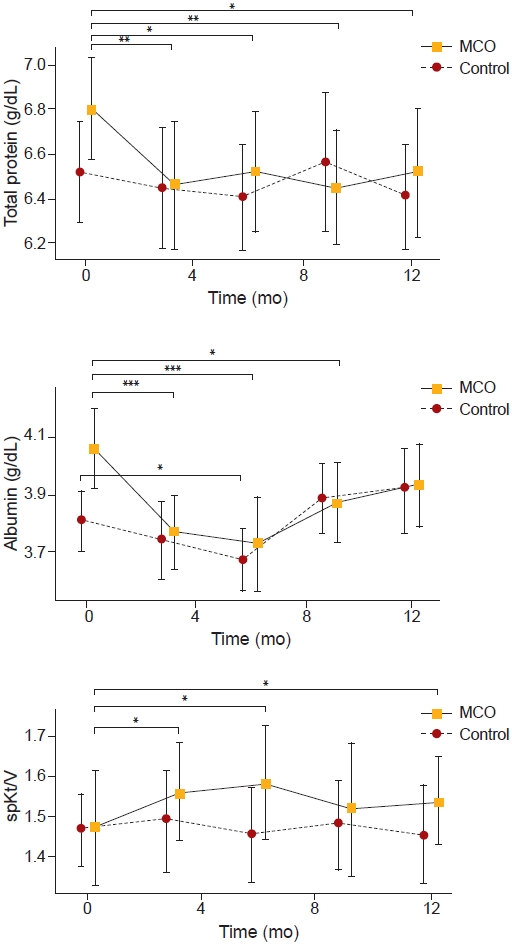
Values are presented as mean changes [95% confidence intervals] and p-values, if otherwise specified. There were no significant changes in serological biomarkers such as Hb and serum phosphorus throughout 12 months of dialysis in both groups. However, total calcium level showed significant change during 12 months of dialysis in the control and MCO groups (–0.547 [–0.854 to –0.241], p = 0.001 vs. –0.594 [–0.929 to –0.258], p = 0.002). Serum PTH level did not show significant change during 12 months of dialysis in the MCO group compared to the control group (control group: 124.428 [6.765 to 242.093], p = 0.001 vs. MCO group: 163.216 [–33.050 to 359.481], p = 0.097, respectively). Moreover, the MCO group showed a significant change in total protein during 12 months of dialysis (control group vs. MCO group: –0.111 [–0.297 to 0.077], p = 0.231 vs. –0.288 [–0.506 to –0.069], p = 0.013). The LTI values in both groups showed decreasing tendency, but there was no statistical significance (control group vs. MCO group: –0.650 [–1.360 to 0.060], p = 0.07 vs. –0.744 [–1.492 to 0.005], p = 0.066) (Table 2, Fig. 1). In addition, there were non-significant differences in nPCR values (mean ± SD) at 3, 6, 9, and 12 months of dialysis, associated with serum albumin, nutritional status, or daily protein intake in dialytic patients, between control and MCO groups (3 months: 1.164 ± 0.148 g/kg/day vs. 1.258± 0.273 g/kg/day, p = 0.233; 6 months: 1.204 ± 0.185 g/kg/day vs. 1.231± 0.296 g/kg/day, p = 0.750; 9 months: 1.175 ± 0.195 g/kg/day vs. 1.185 ± 0.203 g/kg/day, p = 0.889; 12 months: 1.195 ± 0.214 g/kg/day vs. 1.221 ± 0.272 g/kg/day, p = 0.758) (Fig. 2) [24]. Moreover, compared to the changes of total protein levels, serum albumin level in the MCO group did not show a significant decreasing tendency during 12 months of treatment (–0.138 [–0.295 to 0.0020], p = 0.083) (Table 2). Additionally, spKt/V values increased during the 12-month dialysis period in the MCO group only (control group vs. MCO group: –0.015 [–0.081 to 0.052], p = 0.639 vs. 0.069 [–0.123 to 0.150], p = 0.041) (Table 2).
Changes in plasma levels of larger middle molecules and middle molecules during the 12-month treatment period
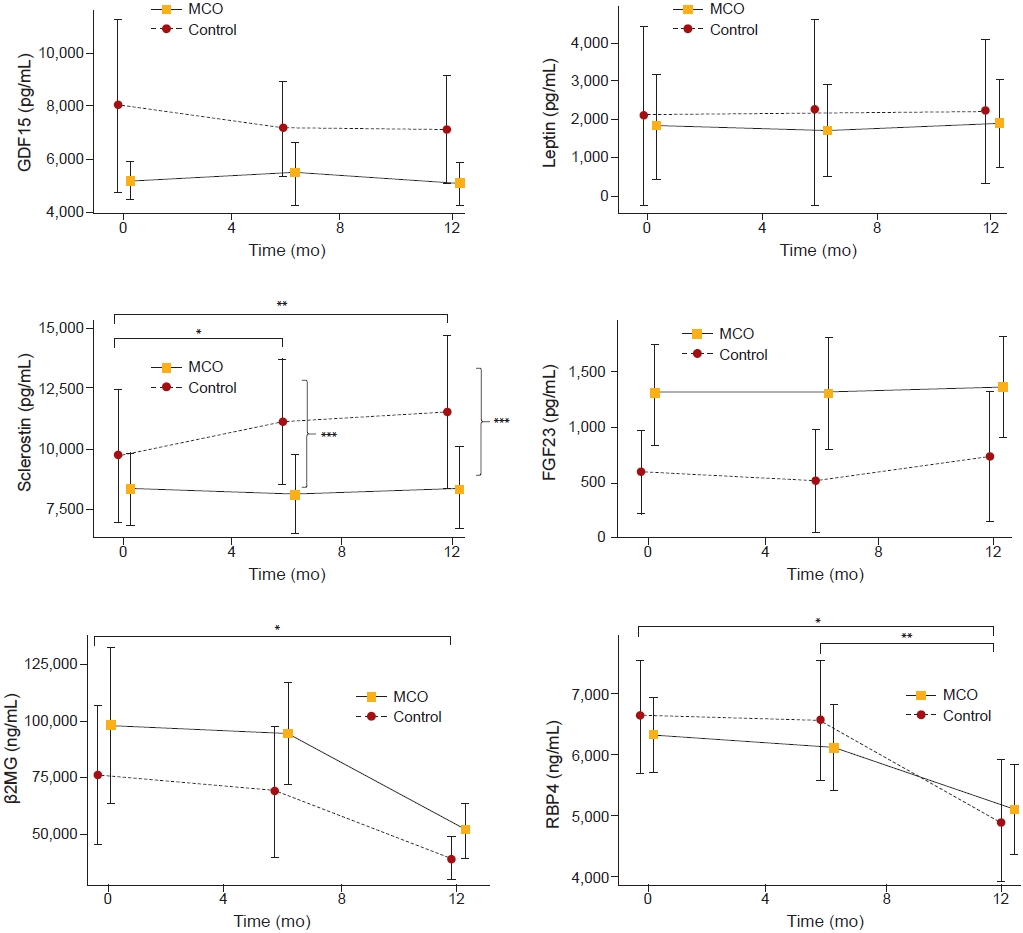
This study also showed 12-month outcomes regarding changes of larger middle molecules, such as GDF15, leptin, sclerostin, FGF23, RBP4, and CRP, and the middle molecule, such as β2MG, in patients using the MCO membrane. The plasma levels of RBP4 and β2MG after 12 months significantly decreased in both groups (RBP4: control group, –17,337.286 [–32,002.551 to –2,672.020], p = 0.028 vs. MCO group, –14,794.667 [–21,606.880 to –7,982.453], p = 0.006; β2MG: control group, –35,975.571 [–67,157.403 to –4,793.740], p = 0.030 vs. MCO group, –61,236.067 [–95,247.526 to –27,224.607], p = 0.001). However, compared with the control group, change of plasma sclerostin in the MCO group was not significant (control group: 1,865.143 [875.649 to 2,854.637], p = 0.004 vs. MCO group: 135.294 [–637.726 to 908.314], p = 0.715). There was no a significant increase in levels of plasm sclerostin in the MCO group compared with those in the control group throughout 12 months. There was also a significant difference between the two groups in change of plasma sclerostin over 12 months (adjusted mean difference between the groups [95% CI], –1,646.916 [–3,015.150 to –278.682], p = 0.021) (Table 3, Fig. 3). Also, while the control group showed a negative association between changes in total calcium and plasma sclerostin levels, the MCO group did not show this negative association (control group vs. MCO group: r = –0.758, p = 0.048 vs. MCO group: r = –0.142, p = 0.587). Moreover, the changes of other biomarkers, such as serum phosphorus, CRP, albumin, and total protein, did not show a significant association with change of plasma sclerostin level in either group (Table 4).
Solute clearance of several biomarkers including larger middle molecules during a single dialytic session after 12 months
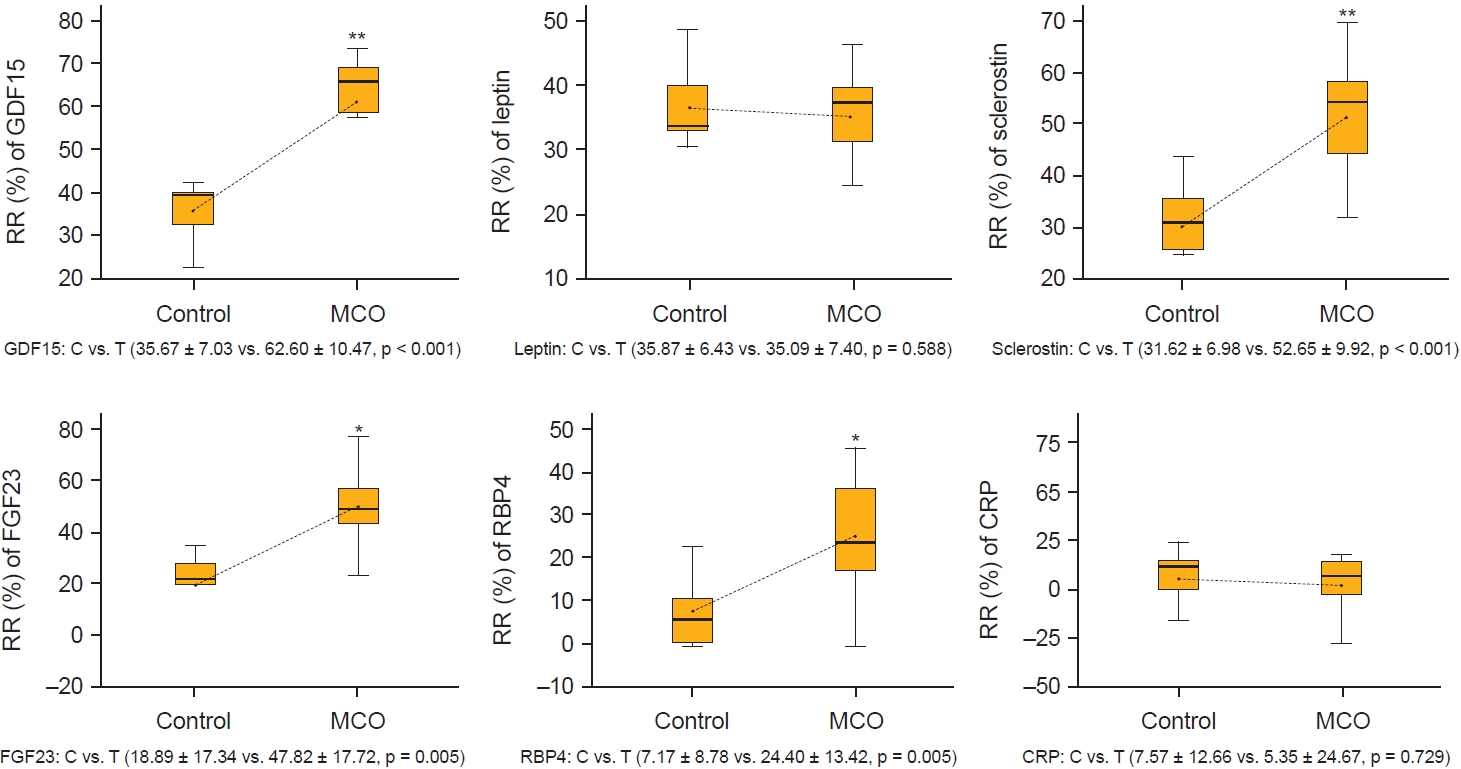
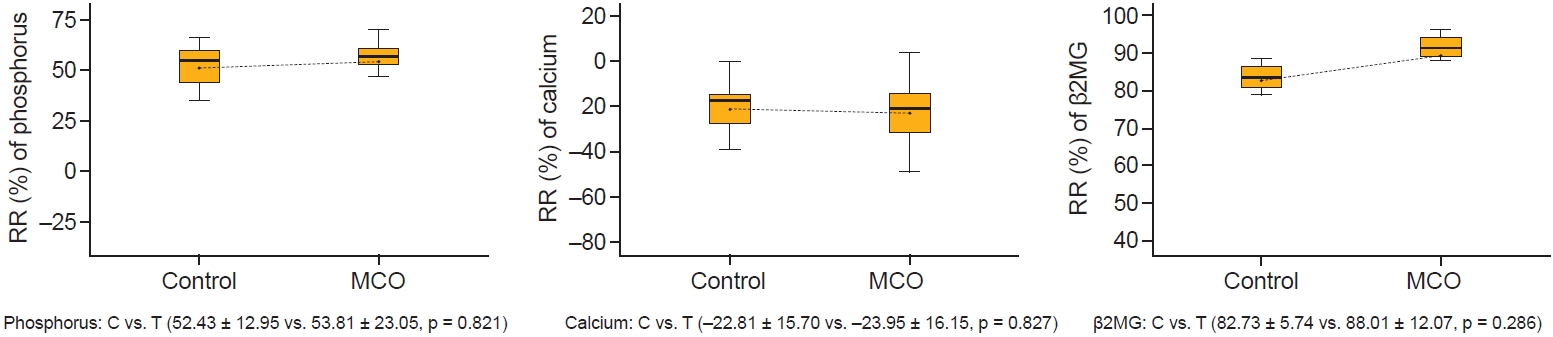
We calculated the RRs at 12 months after application of MCO or HF dialyzer to identify the removal of several solutes including small molecules and larger middle molecules during a single session of HD. Values are presented as means ± SDs and p-values. The RR per dialytic session of larger middle molecules except leptin and CRP was significantly higher in the MCO group than in the control group (control group vs. MCO group: GDF15, 35.67 ± 7.03 vs. 62.60 ± 10.47, p < 0.001; leptin, 36.87 ± 6.43 vs. 35.09 ± 7.40, p = 0.588; sclerostin, 31.62 ± 6.98 vs. 52.65 ± 9.92, p < 0.001; FGF23, 18.89 ± 17.34 vs. 47.82 ± 17.72, p = 0.005; RBP4, 7.17 ± 8.76 vs. 24.40 ± 13.42, p = 0.005; CRP, 7.57 ± 12.66 vs. 5.35 ± 24.67, p = 0.729) (Fig. 4). However, the RRs of small or middle molecules of serum phosphorus, total calcium, and β2MG did not show a significant difference between the two groups (control group vs. MCO group: serum phosphorus, 52.43 ± 12.95 vs. 53.81 ± 23.05, p = 0.821; total calcium, –22.81 ± 15.70 vs. –23.95 ± 16.15, p = 0.827; β2MG, 82.73 ± 5.74 vs. 88.01 ± 12.07, p = 0.286) (Fig. 5). In our study, the solute clearance of the MCO dialyzer is superior to that of the HF dialyzer in removal of larger middle molecules in dialytic patients.
Discussion
The MCO dialyzer is an emerging technology characterized by narrow inner diameters of hollow fibers and large-sized pores with uniform distribution. These physical characteristics resulted in increased internal filtration within the membrane. Moreover, advanced sieving profiles and increased internal filtration easily enabled convective movement of large uremic solutes, even in conventional HD that requires no replacement fluids [26]. In most studies, the MCO dialyzer has shown excellent solute clearance of larger middle molecules in the clinical setting [1,7,27]. However, a recent study reported that the plasma levels of κFLC and λFLC during the first 2 weeks after application of the MCO dialyzer sharply decreased and remained low for another 2 weeks [28]. Factors such as increased production rate of uremic toxins, limited time for removal of uremic toxins, and redistribution from sequestrated tissue during the inter-dialytic period would halve the effect of high RRs when using the MCO dialyzer [6,9,29]. In our study, the plasma levels of β2MG and RBP4 significantly decreased in both groups, but the plasma levels of other larger middle molecules did not. Plasma sclerostin, GDF15, and FGF23, compared to plasma β2MG and RBP4, are significantly associated with parameters such as serum phosphorus, calcium, PTH, and vitamin D. Thus, we should consider the relationships between various parameters, such as phosphorus, calcium, PTH, and vitamin D, and larger middle molecules including sclerostin to identify their changes. The association between the above solutes would influence predialytic concentration over a relatively long period. Generally, serum sclerostin level is inversely associated with serum PTH level, and intermittent infusion of PTH can inhibit the production of sclerostin in osteocytes. Moreover, persistently increased sclerostin level can lead to a low-turnover bone disorder in HD patients. Thus, a high level of sclerostin may be a good biomarker for mineral bone disorder in HD patients [30,31]. In the present study, plasma sclerostin level tended to increase in the control group but not in the MCO group. Furthermore, there was no significant association between changes in total calcium and sclerostin levels in the MCO group compared to the control group. Although the association between the other parameters and sclerostin level in HD patients is unclear [15,30], the present results suggest that the long-term use of the MCO dialyzer can suppress the characteristic increase of plasma sclerostin level in HD patients. In present study, MCO dialyzer compared to HF dialyzer showed a significantly higher RR for plasma sclerostin. Although plasma sclerostin level may rebound for interdialytic period, a repetitive application of MCO dialyzer during relatively long period may temporarily reduce the increase of predialytic sclerostin level regardless of the changes in serological parameters. If several cardiac markers, including parameters related to vascular calcification and echocardiographic parameters, were simultaneously analyzed in present study, the observed significant change in predialytic sclerostin level after application of MCO membrane during a relatively long period could provide more clinical significance.
Theoretically, one of the important concerns surrounding long-term use of the MCO dialyzer is the modest reduction of serum albumin level. However, there was no reduction in serum albumin level during use of the MCO dialyzer over 12 months in this study. The decreasing tendency of serum albumin was no longer observed after 9 months in the MCO group (Fig. 1). Compared to serum albumin level, total protein levels tended to decrease in the MCO group, but nPCR values, which indicate nutritional status or daily protein intake, in HD patients at 3, 6, 9, and 12 months did not show a significant difference between the two groups. In addition, LTI level after 12 months did not decrease significantly in the MCO group. Although additional long-term studies with larger scale are required, these results suggest that use of the MCO dialyzer is not inferior to that of the HF dialyzer in terms of albumin loss over a 12-month period. Interestingly, our results also showed that dialysis adequacy (spKt/V) was significantly higher in the MCO group than in the control group. In our opinion, the increased dialysis adequacy after 12 months in the MCO group may result from the impact of increased internal filtration in the MCO membrane and larger dialyzer surface area (Polyflux 140H, 1.4 m2 vs. MCO 400, 1.7 m2). These results suggest that clinical use of the MCO membrane is not inferior to that of the HF membrane, particularly in terms of changes of serum albumin, nPCR, LTI values, small solutes, and spKt/V over a 12-month period.
In addition, there were no deaths in either group during the study, and the incidence of cardiovascular adverse events did not show significant difference between the two groups. To be specific, acute myocardial infarction developed 6 months after enrollment for one patient in the MCO group, and nonfatal stroke developed 12 months after enrollment for one patient in the control group.
This study has several limitations. First, we utilized frozen, stored blood samples for this study; indicating use of degraded samples. We did not consider residual renal function in enrolled patients. Moreover, this study has a small sample size. Additionally, because significant albumin loss due to chronic use of the MCO membrane has been reported, younger and relatively healthier patients were primarily enrolled into the MCO group at baseline [1,32]. Thus, baseline serum phosphorus and albumin levels were higher and OH% values were lower in the MCO group. This study is not a randomized controlled trial but an observational cohort study. Categorization of patients who showed uncontrolled hyperphosphatemia, secondary hyperparathyroidism, and well-nutritional status into the MCO group could lead to selection bias. Furthermore, quantification of mortality and morbidity differences between two groups was difficult due to the short study duration and small sample size. Despite these, our study has several strengths. First, only one type of dialytic machine was used in both groups. Second, changes in larger middle molecules associated with cardiovascular risk factors or vascular calcification were analyzed during a relatively long-term period (12 months). Third, we analyzed other biomarkers such as dialysis adequacy (spKt/V) and body composition index with short-term intervals during the 12-month period.
Conclusively, this study showed the 12-month outcome in changes of larger middle molecules in HD patients using the MCO dialyzer. Among these molecules, plasma sclerostin did not increase significantly in the MCO group. The RRs of larger middle molecules by a single dialytic session were prominently higher in the MCO group. In addition, long-term use, over 12 months, of the MCO dialyzer increased spKt/V without modest albumin loss or significant adverse effect. Therefore, if longer-term and more frequent use of the MCO dialyzer is possible, HD using the MCO dialyzer may be an option for reduction of larger middle molecules.

 PDF Links
 PubReader
 ePub Link
 Full text via DOI
 Download Citation
 Print
Print


")


