


Introduction
Chronic kidney disease (CKD) is a global health problem affecting 8% to 16% of adults [1]. Defined as decreased kidney function for > 3 months, individuals with CKD are at increased risk of morbidity and early mortality [1]. Cardiorespiratory fitness is defined as the integrated ability of the circulatory and respiratory systems to supply oxygen during sustained physical activity [2], and it is widely considered to be the best reflection of whole-body health and function [3]. Low cardiorespiratory fitness is strongly associated with early all-cause and cardiovascular-related mortality [3,4] and presents a higher risk of early death than other common risk factors such as diabetes or hypertension [5]. Compared to the general population, CKD patients demonstrate a large reduction in cardiorespiratory fitness that occurs early in the disease process and declines concomitantly with renal function [6,-8]. In patients with CKD, low cardiorespiratory fitness is associated with increased aortic stiffness and left ventricle afterload, poor left ventricle function, and a higher burden of cardiovascular risk [8], and it is unsurprisingly an independent predictor of early mortality [9,10]. Many patients with renal disease have cardiorespiratory values comparable to those with mild heart failure [11].
Cardiopulmonary exercise testing (CPET) is a universal assessment of cardiorespiratory fitness that uses a breath-by-breath gas exchange analysis to provide an objective and accurate measurement of oxygen uptake [3]. Although the measurement of maximal oxygen uptake (Ō®ÆO2max) is the most reliable measure of exercise capacity, this value is seldom achieved because it demands maximal effort from the individual being tested and a plateau in oxygen uptake despite an increasing exercise workload, which limits its usefulness in groups such as the elderly and those with chronic disease [12]. Consequently, in such groups and in patients with renal disease, cardiorespiratory fitness is typically derived from Ō®ÆO2peak because many patients prematurely stop the test due to fatigue or breathlessness [6]. Ō®ÆO2peak is also limited by the strong influence of motivation and the subjective choice of a test endpoint [12].
Baba et al [13] developed an objective, reproducible estimation of cardiorespiratory function called the oxygen uptake efficiency slope (OUES) that does not require a maximal exercise effort and might therefore be useful in populations, such as CKD patients, deemed high risk for maximal exercise testing [7]. The OUES integrates cardiovascular, musculoskeletal, and respiratory function into a single index [14]. Remaining relatively stable across CPET duration, the OUES represents the relationship (and efficiency) between oxygen uptake and total ventilation and provides an indication of cardiorespiratory reserve, so it could be a more pragmatic and safer alternative to maximal exercise testing in high-risk patients [7]. In patients with heart failure, the OUES has superior independent prognostic value over other commonly reported CPET-derived values such as Ō®ÆO2peak and the Ō®ÆE/Ō®ÆCO2 slope [15]. Although research on the subject is scarce, Kirkman et al [7] showed a 16% reduction in the OUES in CKD patients compared to healthy controls.
Generally, although not always [16,17], exercise training can increase Ō®ÆO2peak in patients with CKD [17,18]. However, little is known about the effect of exercise interventions on the OUES in any population. In patients with chronic heart failure (CHF) [14,19] or coronary artery disease (CAD) [20,21] and those undergoing hemodialysis (HD) [22], the OUES increased by 17% to 21% following exercise. An increase in the OUES suggests that a given oxygen uptake is achieved with lower ventilatory cost [21], although not all research supports those findings [23].
In this secondary analysis of previous research [16], we explore the response of the OUES to a 12-week exercise training program in patients with CKD. We hypothesized that 12 weeks of exercise would increase the OUES without necessarily changing the Ō®ÆO2peak, indicating improvements in oxygen utilization efficiency.
Methods
Participants
Patients were recruited from nephrology outpatient clinics and included if they had CKD 3b-5 not requiring dialysis. Exclusion criteria were: 1) aged < 18 years; 2) body mass index > 40 kg/m2; 3) physical impairment preventing the completion of the study assessments; 4) myocardial infarction within < 6 months; 5) any unstable chronic condition (e.g., diabetes); and 6) inability to give informed consent.
All procedures performed in studies involving human participants were in accordance with the ethical standards of the institutional and/or national research committee at which the studies were conducted (National Research Ethics Committee, East Midlands-Northampton (13/EM/0344)) and with the 1964 Helsinki declaration and its later amendments or comparable ethical standards.
Study design
This is a secondary analysis of data collected during an exercise trial (registered at ISRCTN 36489137) that took place at the University Hospitals of Leicester NHS Trust between December 2013 and October 2016. A full description of the methods can be found in Watson et al [16]. Informed consent was obtained from all individual participants included in the study. Assessment outcomes were conducted at baseline and then again pre- and post-exercise intervention. To negotiate the absence of a control group, patients underwent a 6-week control period prior to randomization between the baseline and pre-exercise assessment sessions.
Exercise intervention
Patients attended the research gym three times a week for 12 weeks. Patients were randomized (stratified for estimated glomerular filtration rate [eGFR]) into one of two supervised exercise groups:
Aerobic exercise group (AE group): 70% to 80% of maximum heart rate [HR], 30 minutes duration in each session, performed on standard cardiovascular equipment (e.g. treadmill);
Combined exercise group (CE group): a combination of aerobic exercise (as above but for 20 minutes duration on two sessions, 30 minutes aerobic exercise only for the remaining session), plus resistance training (~70% one repetition maximum, three sets of 8 to 12 repetitions) on a leg extension and leg press machine in the two sessions with 20 minutes of aerobic exercise.
Cardiopulmonary exercise testing
A symptom-limited, graded, maximal effort CPET was performed on a cycle ergometer (Lode Excalibur, Groningen, The Netherlands). Following a 3-minute warm-up at a resistance of 50 watts (W), patients were instructed to cycle > 60 revolutions per minute (RPM). The work rate was increased by 1 W every 4 seconds (15 W/min) using a ramp protocol of incremental workloads (Cortex MetaLyzer3B-R2 with Metasoft CPX software 3.0.68, Leipzig, Germany). The test was stopped if RPM dropped < 60, the participant reached volitional exhaustion, or if the supervising cardiac nurse stopped the test because of echocardiogram changes or an undue rise in blood pressure. Total exercise duration was recorded in seconds.
Direct measurements of oxygen consumption (Ō®ÆO2), minute ventilation (Ō®ÆE), and respiratory rate (RR) were obtained, and several derived variables such as the respiratory exchange ratio (RER, i.e., Ō®ÆO2/Ō®ÆCO2), ventilatory threshold (VT), and the ventilatory equivalents for oxygen (Ō®ÆE/Ō®ÆO2) and carbon dioxide (Ō®ÆE/Ō®ÆCO2) were calculated. The flowmeters and gas analyzers were calibrated before every test for accuracy and linearity with a syringe of known volume and precisely analyzed gas mixtures, respectively. The data pertaining to VO2peak following exercise were previously presented [16], but they are included here to provide a comparison with the utility of the OUES.
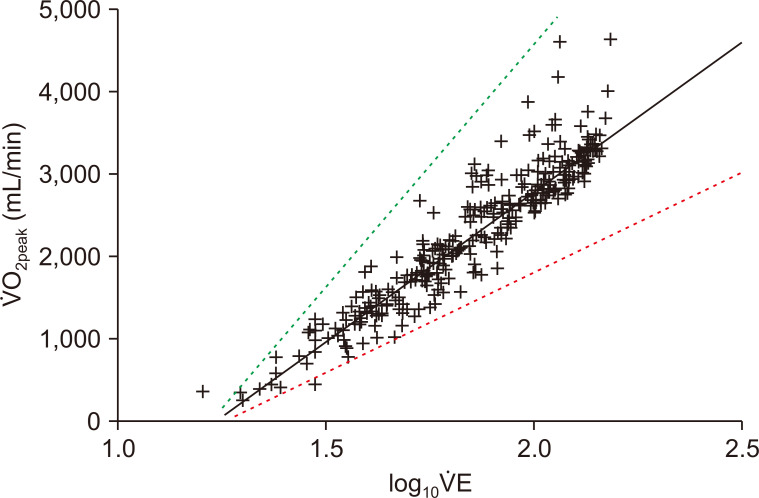
The OUES reflects the relationship between Ō®ÆO2 (mL/min) and the log10 transformation of Ō®ÆE (L/min)[13]:
When Ō®ÆO2 is plotted on the y axis and log10 Ō®ÆE is plotted on the x axis, the slope of this linear relationship, ŌĆśaŌĆÖ, represents the OUES. An example of this relationship is shown in Fig. 1. Here, a steeper slope would represent more efficient oxygenation, and conversely, a shallower slope indicates that a greater amount of ventilation is required for any given oxygen uptake. To evaluate its usefulness as a cardiorespiratory index derived from a submaximal exercise test, the OUES was calculated from data taken at 50%, 75%, 90%, and 100% of the total exercise duration (i.e., excluding the warm-up and recovery).
Statistical analysis
As a secondary per-protocol analysis [16], no prior sample size calculation is provided for the outcomes presented. Only patients with completed CPETs at each of the three study timepoints were included in this analysis. Data are presented as mean ┬▒ standard deviation (SD), unless stated otherwise. The 95% confidence intervals (95% CIs) were calculated for changes between the baseline, pre-, and post-exercise interventions. Within-group differences were assessed using paired-samples t tests. Between-group differences were assessed using linear regression modeling adjusted for age, sex, ethnicity, eGFR, and baseline values. Differences in the OUES calculated at 50%, 75%, 90%, and 100% of exercise duration at each timepoint were assessed using inter-item coefficients and CronbachŌĆÖs ╬▒ (r). Data were analyzed using IBM SPSS Statistics version 24.0 (IBM Corp., Armonk, NY, USA) and GraphPad PRISM 7.0 (San Diego, CA, USA). Significance was recognized as P < 0.05.
Results
Participant characteristics
Basic patient demographics and clinical characteristics are shown in Table 1. The mean age was 61.1 ┬▒ 12.1 and 56.3% of patients were female. Most patients were in CKD 3-4 with an average eGFR of 25.3 ┬▒ 7.4. Clinical parameters were well controlled with a mean hemoglobin of 119.4 ┬▒ 15.1 g/L and blood pressure of 130.6 ┬▒ 18.9 /72.0 ┬▒ 11.6 mmHg. No variable collected during the baseline CPET differed between those with CKD 3 and those with CKD 4/5, including Ō®ÆO2peak (20.3 ┬▒ 2.9 vs. 19.2 ┬▒ 6.8 mL/min kg-1, P = 0.513) and OUES (100%) (2,198.7 ┬▒ 612.3 vs. 2,169.3 ┬▒ 717.0) (other data not shown).
Changes during 6-week control period
No significant changes in any variable were observed during the 6-week control period (Table 2). Although nonsignificant, modest increases in Ō®ÆO2peak, peak Ō®ÆE/Ō®ÆO2, and peak RR were observed. Body mass was reduced by 0.7 (95% CI, -1.5 to 0.1) kg following the 6-week control period. The mean duration of the CPET differed by 1.0 (95% CI, -42.4 to 40.5) second.
Response to 12 weeks of exercise in other parameters
A modest but nonsignificant mean increase of 0.8 (95% CI, 0.0 to 1.7) mL/min kg-1 (4%) was seen in Ō®ÆO2peak across all patients (Table 2), with no differences observed across groups (P = 0.602) (Table 3). This increase was comparable to the 0.8 (95% CI, -0.3 to 1.8) mL/min kg-1 increase observed during the control period. No changes were observed in Ō®ÆO2peak expressed as L/min (P = 0.239).
No changes in breathing efficiency indices (peak Ō®ÆE/Ō®ÆO2 and Ō®ÆE/Ō®ÆCO2) were observed in either group, although Ō®ÆE increased by 8.0 (95% CI, 1.1 to 15.0) liters in the AE group (P = 0.026). Peak RER increased when all patients were analyzed as a single group (P = 0.042), although no differences were observed between groups. Peak RR increased by 2.9 (95% CI, 0.6 to 5.2) breaths per minute in the CE group (P = 0.017). No change in peak HR was seen in either group (P = 0.568). The duration of the CPET increased following exercise training in both groups, by 44.9 and 37.4 seconds in the AE group (P = 0.026) and CE group (P = 0.044) groups, respectively (Table 2 and 3).
Response to 12 weeks of exercise in the OUES
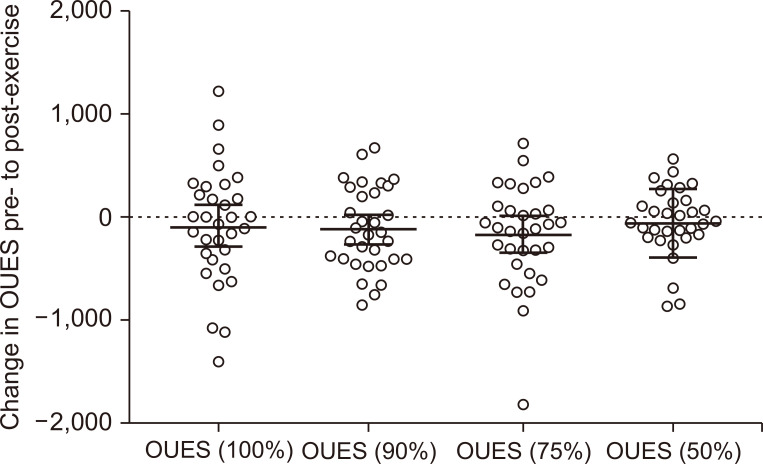
The OUES calculated at 100%, 90%, 75%, and 50% of exercise duration did not change after 12 weeks of exercise (Fig. 2 and Table 2), although we did observe a reduction in the OUES at 90% in the AE group (P = 0.029) (Table 3). The responses to exercise produced more variable OUES values than Ō®ÆO2peak values. After training and across all patients, OUES (100%) decreased by 4% (95% CI, -13% to 5%), OUES (90%) decreased by 5% (95% CI, -12% to 1%), OUES (75%) decreased by 8% (95% CI, -16% to 2%), and OUES (50%) decreased by 2% (95% CI, -8% to 4%); this contrasts with a 4% (95% CI, 0% to 8%) increase in Ō®ÆO2peak. No correlation was found between the change in Ō®ÆO2peak and that in OUES (100%) (r = 0.052, P = 0.776).
Sensitivity of submaximal OUES values
The OUES values calculated at 50%, 75%, and 90% of exercise duration were consistent with those from OUES (100%) at each timepoint (CronbachŌĆÖs ╬▒ r = 0.934 to 0.948) (Table 4). OUES (90%) was most highly correlated with OUES 100% at baseline (inter-item coefficient r = 0.830) and pre-exercise (r = 0.873). The weakest association was observed between the OUES (50%) values at different timepoints.
Relationship between oxygen uptake and OUES values
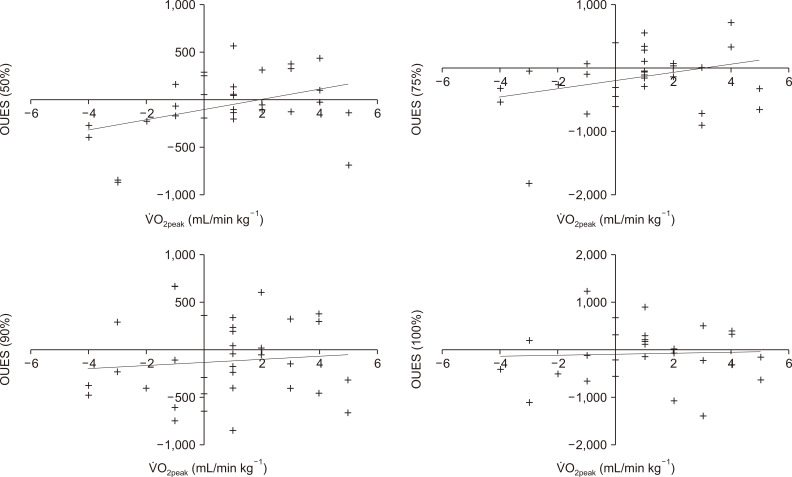
We observed significant associations between baseline Ō®ÆO2peak and OUES (100%) (r = 0.480, P = 0.005), OUES (90%) (r = 0.505, P = 0.003), OUES (75%) (r = 0.640, P Ōēż 0.001), and OUES (50%) (r = 0.600, P Ōēż 0.001). Ō®ÆO2peak was also associated with Ō®ÆE (r = 0.743, P Ōēż 0.001). Fig. 3 shows the association between changes in the Ō®ÆO2peak and OUES values. The only significant association observed was with OUES (50%) (r = 0.399, P = 0.024).
Discussion
This is the first study to describe the effects of exercise on the OUES in patients with CKD. Our results show that 12 weeks of exercise had no beneficial effects on the OUES, and no meaningful differences appeared between the exercise modalities tested. The lack of change in the OUES supports the insignificant and modest change observed in Ō®ÆO2peak. Exercise-induced responses in the OUES appeared to be more variable than changes in traditional parameters such as Ō®ÆO2peak. The lack of change could indicate a dysfunctional cardiorespiratory response to exercise in patients with CKD.
Since the introduction of the OUES [13], its use as an objective, reproducible estimation of cardiorespiratory function in clinical populations has grown. Integrating cardiovascular, musculoskeletal, and respiratory function into a single index [14], the OUES represents the relationship between oxygen uptake and total ventilation. Given its linear presentation, the advantage of the OUES is its ability to obtain a valid measure with submaximal effort, which reduces reliance on parameters such as Ō®ÆO2peak that are strongly influenced by motivation and the choice of test endpoint [12]. Research exploring the role of the OUES in kidney disease has been limited. Kirkman et al [7] found that the OUES of 31 patients was 16% lower than that of healthy controls. Suggestive of further underlying cardiovascular dysfunction, other parameters, such as Ō®ÆO2peak, VT, Ō®ÆE/Ō®ÆCO2, and Ō®ÆE/Ō®ÆO2, were also impaired. Similarly, research by Tsuyuki et al [24] found a reduced OUES in HD patients. Given its prognostic value [15] and use as a potential marker of cardiorespiratory function, efforts to improve OUES values could be beneficial.
Given the lack of major differences between exercise modality groups, we focus on all patients as one cohort in this discussion. We observed a modest, nonsignificant increase in Ō®ÆO2peak of 0.8 mL/min kg-1 or ~4%. This result is well below the generally accepted minimal clinically important difference of 1.5 mL/min kg-1 [25] and supports the conclusions of some previous exercise studies in CKD that showed inadequate change [26,27]. Nevertheless, it does contrast with most of the findings from a recent systematic review and meta-analysis that reported a pooled increase of 2.4 (1.0 to 3.8) mL/min kg-1 (~11%) in patients with CKD following exercise [17]. Notably, we found that the increase after exercise was identical to that observed during the control period. Previous work by our group has shown that the minimal detectable change in Ō®ÆO2peak is 0.5 mL/min kg-1 [25], and as such, the change in Ō®ÆO2peak observed here is likely due to methodological limitations and the error inherent in this test. Improvements in relative Ō®ÆO2peak (i.e., adjusted for kg) could also be explained by the concurrent changes in body mass seen throughout the study. That possibility is supported by the complete lack of change when Ō®ÆO2peak is expressed in liters.
We expected the OUES to overcome the limitations associated with Ō®ÆO2peak measurement. However, contrary to our original hypothesis, we observed no changes in the OUES calculated at any stage of test duration in either group. This includes OUES (75%), which was proposed [13] to replace Ō®ÆO2peak or OUES (100%) because it does not rely on maximal effort. Our observations extend the results of Mourot et al [23], who reported that, despite an increase in Ō®ÆO2peak, no change occurred in the OUES of healthy young women following 6 weeks of exercise. However, our results contrast with previous research in CHF [14,19], CAD [20,21], and HD [22] that has shown improvements in the OUES in the region of 17% to 21%, with changes in the OUES corresponding to improvements in Ō®ÆO2peak. Interestingly, changes in the OUES corresponded to changes in oxygen uptake but only during the first half of the exercise test. At the end of the test, changes in the OUES and Ō®ÆO2peak had no relationship. This finding could be due to the submaximal intensity of the first part of the test or variable attainments of true peak values in this group.
Many mechanisms can influence the OUES, including physiologic pulmonary dead space, which depends on the structural integrity of the lungs and the adequacy of pulmonary perfusion; the PaCO2 set-point; and the timing and degree of metabolic acidosis, namely, the amount of blood perfusion to the working muscles [12,19,22]. Consequently, a large (superior) OUES depends on a substantial mass of working muscle, a vigorous and unimpaired blood flow to those muscles, efficient extraction and use of oxygen by those muscles, and the delayed appearance of lactic acidosis [12]. As such, improvements in the OUES in response to exercise are thought to be driven primarily by peripheral metabolic adaptations, such as increased aerobic metabolism [20], specifically increases in capillary density, muscle blood flow, and mitochondrial density that delay the onset of metabolic acidosis, thereby decreasing the ventilatory response during exercise [19,-21].
The absence of change in the OUES of our CKD patients could be caused by a myriad of factors, although is likely due to dysfunctional peripheral metabolic mechanisms. Skeletal muscle mitochondrial abnormalities have been noted in patients with CKD [28]. To date, data from human studies are lacking, but skeletal muscle biopsies taken from CKD patients have revealed reduced mitochondrial density and mitochondrial DNA copy numbers, abnormal morphology, and reduced activity of pyruvate dehydrogenase [29], a key coupling enzyme in cellular respiration [30]. Dysfunctional mitochondria are an important source of reactive oxygen species, implicated in cardiovascular morbidity and mortality [31,32]. Patients with mitochondrial dysfunction are unable to adequately use O2 for oxidative phosphorylation; instead, lactic acid accumulates early in exercise, which leads to exaggerated circulatory and ventilatory responses [33]. Research by our group showed greater than normal deoxygenation of skeletal muscle hemoglobin in CKD patients during an incremental exercise test, which we hypothesized to indicate reduced mitochondrial and oxidative phosphorylation capacity [34]. We have also recently shown that at the cellular level, exercise training has no effect on mitochondrial mass or the mRNA expression of key proteins involved in mitochondrial biogenesis [35]. This points toward an intrinsic defect in our population in regard to their mitochondrial function.
Metabolic acidosis is a common complication in patients with CKD [36], and it has been implicated in the induction of mitochondrial dysfunction [36]. Early onset of lactate production during exercise testing has previously been observed in HD patients [37], and although research in earlier stages of CKD is limited, Sprick et al [38] found that metabolic acidosis contributes to exercise intolerance in CKD by promoting earlier fatigue and exacerbation of blood pressure reactivity during exercise. In deconditioned patients (such as those with chronic disease) who develop lactic acidosis early during exercise, the OUES will be expected to be diminished [12]. Exercise training has been shown to inhibit exercise-induced metabolic acidosis in healthy individuals and in those with CHF [22], but in the uremic milieu associated with CKD, this response could be diminished.
In our study, CKD-related peripheral limitations on exercise capacity are further indicated by an elevated ventilatory cost of oxygen uptake (Ō®ÆE/Ō®ÆO2) compared with values found in those without CKD [7]. In individuals with mitochondrial myopathies, steep Ō®ÆE/VO2 slopes are observed because O2 delivery exceeds the capacity for utilization [38]. The ability of peripheral vessels to dilate in response to increased shear stress during exercise has emerged as an important determinant of exercise capacity. In patients with CKD, vascular endothelial dysfunction, as evidenced by increased arterial stiffness, is thought to contribute to exercise intolerance [39,40]. The lack of change in the OUES could also be caused by the highly variable response of this value to exercise, and it might not be a sensitive marker in CKD. This supports conclusions already drawn by others [23].
We observed little response to exercise in the other cardiorespiratory parameters we tested, although we did observe an increase in Ō®ÆE and RR. The increase in Ō®ÆE was found in the AE group only, and increased RR was identified in both groups. Ō®ÆE is a product of both tidal volume and RR [33]; therefore the increase seen in Ō®ÆE following exercise is likely partly explained by the increase in RR during the test. Following the intervention, the duration of the CPET increased, which might have increased the effort required to sustain the desired workload. This increased duration might also have required increased Ō®ÆE and RR. An increased peak Ō®ÆE (and/or RR) value with a relatively invariable VO2, as observed in our sample, could also be characteristic of inefficient breathing patterns [33]. Despite an increase in VE, we observed no change in the Ō®ÆE/Ō®ÆCO2 slope, suggesting no improvement in CO2 exhalation and no reduction in lactic acid production [19]. Kirkman et al [7] previously showed an increased Ō®ÆE/Ō®ÆCO2 slope in patients with CKD versus healthy controls. The high Ō®ÆE/Ō®ÆCO2 slope observed in our sample could represent impaired ventilatory efficiency, and our mean values at each timepoint, all > 34, indicate an abnormal ventilatory response [33,41] similar to those seen in patients with pulmonary disease and CHF [33].
Although it is limited by the absence of a non-exercising control group, our study benefits from having a control period in which we could assess normal variations in the parameters reported. This was important because it allowed us to observe increases in Ō®ÆO2peak comparable to those from the 12-week exercise program, supporting the finding that aerobic capacity was unchanged by exercise. It is unlikely that this was caused by an inadequate training stimulus (i.e., duration or intensity) because significant improvements in body composition, strength, and other physical functions were observed as a result of the program [16]. We were able to show good reproducibility of the OUES before and after this control period, with the OUES (100%) differing by just 0.4%. As a secondary analysis, the results here might not be powered to detect statistically significant changes, and therefore they need to be confirmed in larger trials with this population.
In conclusion, we were unable to obtain an improvement in the OUES after 12 weeks of exercise in patients with CKD. The OUES was hypothesized to be a useful index that circumvents the methodological limitations of maximal exercise testing in evaluating cardiorespiratory reserve in patients. However, although the heterogeneous variation in the OUES response could partly explain our findings, the lack of change in the OUES supports the limited change in Ō®ÆO2peak and other cardiorespiratory parameters measured. Thus, our findings could indicate a dysfunctional cardiorespiratory response to exercise in patients with CKD.
 PDF Links
 PubReader
 Full text via DOI
 Download Citation
 Print
Print


")


