


Introduction
Chronic kidney disease (CKD) is associated with fluid retention, which can cause derangement of body water distribution [1]. Accurate assessment of body composition is essential for the management of CKD.
Bioelectrical impedance is a validated method to analyze body composition. It works by passing electrical currents of different frequencies through the body [2]. At low frequencies, electrical currents measure the resistance (R0) of extracellular water (ECW) [3] as they do not penetrate cell membranes. Higher-frequency currents, which do penetrate cell membranes, measure the resistance (RŌł×) of total body water (TBW) [2,4,5]. Body characteristics can be evaluated using mathematical models and empirical formulae derived from a reference population. Such characteristics include TBW, ECW, intracellular water (ICW), fat mass, lean mass, percentage body fat (% BF), and body cell mass.
Different bioimpedance technologies are employed for body composition assessments [6]. Single, dual, multifrequency, and spectroscopic methods have all been comparedŌĆöwith acceptable agreementŌĆöagainst reference methods of measuring body composition [6ŌĆō8]. Reference methods measure body spaces by radioisotope dilution [2]. However, these methods can be invasive and expensive, and cannot measure volume changes over short periods of time [2]. Multifrequency bioimpedance analysis (BIA) assesses resistance at different frequencies and factors them into empirical linear regression models to measure body composition [9]. Bioimpedance spectroscopy (BIS) uses mathematical modeling and mixture equations such as the ColeŌĆōCole and Hanai formulae to derive relationships between resistance and body fluid compartments to evaluate body composition [9]. Although both methods are commonly used, differences in accuracy and bias have been reported [2,9].
Bioimpedance techniques have been widely used for many studies involving end-stage CKD patients on dialysis [10ŌĆō12]. However, only a few studies compare the use of bioimpedance in pre-dialysis CKD patients of different ethnicities [13ŌĆō15]. Body composition analysis is essential in pre-dialysis kidney patients to optimize nutritional and fluid status [16]. Moreover, the relationship between BIA and body composition in adolescents is ethnicity-dependent and equations used for one ethnic group may not apply to another [17]. The variety of bioimpedance methods makes it important to ascertain the degree of bias between methods and instruments, and correlate these relationships to clinical findings and outcomes [18]. In this study, we compared body composition assessments in BIS against BIA in a multi-ethnic Asian population of stable, non-dialysis CKD patients.
Methods
Patients
We recruited 98 stable, non-dialysis CKD patients whose serum creatinine had not varied by > 20% over three months. The mean age of the patients was 59.9 ┬▒ 12.6 years, 70.4% were Chinese, 8.2% were Malays, 13.3% were Indians, and 8.2% were of another ethnicity. This was an approved clinical research study by the Singapore National Healthcare Group Domain Specific Review Board (DSRB) with consenting human participants (DSRB/IRB number: 2011/00325).
Biochemical measurements
Anthropometry and blood samples were obtained on the day of recruitment. Serum creatinine was measured using a serum creatinase method traceable to SRM 976 on the Siemens Advia platform (Siemens, Munich, Germany). Serum prealbumin and N-terminal prohormone of brain natriuretic peptide (NT-proBNP) were assayed on the Architect platform (Abbot, Abbott Park, IL, USA) in the hospitalŌĆÖs main clinical laboratory. Blood pressures were measured using an automatic oscillometric manometer, according to clinical practice guidelines. A standardized dietary assessment using the subjective global assessment (SGA) was administered and scored on a seven-point scale. A higher score corresponds to a greater degree of malnutrition.
Bioimpedance
BIS was performed using a Fresenius body composition monitor (FBCM; Fresenius Medical Care AG & Co., Bad Homburg vor der H├Čhe, Germany) and BIA was performed on a Bodystat Quadscan 4000 (BQ4000; Bodystat Ltd., Douglas, UK). Measurements were taken in the supine position using two electrodes applied to the right hand and right leg.
Statistical analysis
Patients were analyzed by gender, ethnicity, categories of body mass index (BMI), and estimated glomerular filtration rate (eGFR). Ethnicity was divided into Chinese and non-Chinese Asian to reflect the multi-ethnic society of Singapore, which is 75% Chinese. BMI categories were < 25.0 kg/m2, 25.0 to 30.0 kg/m2, and > 30.0 kg/m2. Glomerular filtration rates were estimated using the CKD-EPI (Chronic Kidney Disease Epidemiology Collaboration) equation. Comparisons were made by eGFR categories < 30, 30 to 60, and > 60 mL/min/1.73 m2. Standard t test, PearsonŌĆÖs correlation, and chi-square statistical tests were applied where appropriate. To assess bioimpedance measures with clinical and biochemical outcomes, we used correlation and linear regression for continuous variables; and logistic regression for discrete variables. To assess the clinical associations of bioimpedance measures of volume, we evaluated TBW, ECW, and ECW/ICW against systolic blood pressure (SBP), diastolic blood pressure (DBP), and plasma NT-proBNP. To assess the clinical correlations of bioimpedance measures of body composition, we evaluated lean mass against serum prealbumin, mid-arm muscle circumference (MAMC), and the SGA score; and fat mass against waist circumference, skin-fold thickness, and the waist-to-hip ratio. Variables with non-normal distribution were natural log-transformed prior to analysis. A P value of < 0.05 was considered significant. Analyses were performed on statistical software of JMP (Cary, NC, USA).
Results
The characteristics of the 98 patients are shown in Table 1.
Body water assessments
Overall body water assessments using BIA produced higher volumes than BIS (4.6 L, P < 0.001) (Table 2). The largest differences were in men (5.4 L, P < 0.001). Overall, ECW using BIA produced higher volumes than did BIS (1.2 L, P < 0.001). The largest difference was in women (1.6 L, P < 0.001). Overall, ICW using BIA gave higher volumes than did BIS (3.2 L, P < 0.001). The largest difference was in patients with a BMI > 30 kg/m2 (4.2 L, P < 0.001). Overall, an ECW/ICW ratio using BIS produced higher values than did BIA (0.10, P < 0.001). The largest difference was in patients with a BMI > 30 kg/m2 (0.13, P < 0.001).
Within eGFR categories, BIA produced higher values than did BIS for TBW assessments. The largest difference was in patients with an eGFR < 30 mL/min/1.73 m2 (4.9 L, r = 0.968, P < 0.001). The least difference was in patients with an eGFR > 60 mL/min/1.73 m2 (4.0 L, r = 0.976, P < 0.001). For ECW assessments, the largest difference was in patients with an eGFR < 30 mL/min/1.73 m2 (1.3 L, r = 0.989, P < 0.001). The least difference was in patients with an eGFR of 30 to 60 mL/min/1.73 m2 (1.1 L, r = 0.996, P < 0.001). For ICW assessments, the largest difference was in patients with an eGFR of 30 to 60 mL/min/1.73 m2 (3.5 L, r = 0.926, P < 0.001). The least difference was in patients with an eGFR > 60 mL/min/1.73 m2 (2.6 L, r = 0.925, P < 0.001). For ECW/ICW ratios, the largest difference was in patients with an eGFR of 30 to 60 mL/min/1.73 m2 (0.11, r = 0.590, P < 0.001). The least difference was in patients with an eGFR > 60 mL/min/1.73 m2 (0.09, r = 0.421, P < 0.001).
Within BMI categories, BIA gave higher values than did BIS for TBW assessments. The largest difference was in patients with a BMI of 25.0 to 30.0 kg/m2 (5.2 L, r = 0.968, P < 0.001). The least difference was in patients with a BMI < 25 kg/m2 (4.0 L, r = 0.956, P < 0.001). For ECW assessments, the largest difference was in patients with a BMI < 25 kg/m2 (1.3, r = 0.996, P < 0.001). The least difference was in patients with a BMI > 30 kg/m2 (1.1 L, r = 0.996, P < 0.001). For ICW assessments, the largest difference was in patients with a BMI > 30 kg/m2 (4.2 L, r = 0.950, P < 0.001). The least difference was in patients with a BMI < 25 kg/m2 (2.1 L, r = 0.913, P < 0.001). For ECW/ICW ratios, the largest difference was in patients with a BMI > 30 kg/m2 (0.13, r = 0.639, P < 0.001). The least difference was in patients with a BMI < 25 kg/m2 (0.07, r = 0.493, P < 0.001).
Between Chinese and non-Chinese, BIA gave higher values than did BIS for TBW assessments. The larger difference was in Chinese (4.8 L, r = 0.973, P < 0.001). For ECW assessments, the larger difference was in non-Chinese (1.2 L, r = 0.995, P < 0.001) (Table 2). For ICW assessments, the larger difference was in Chinese (3.2 L, r = 0.934, P < 0.001). For ECW/ICW ratios, the larger difference was in non-Chinese (0.10, r = 0.451, P < 0.001).
Between men and women, BIA produced higher values than did BIS for TBW assessments. The larger difference was in men (5.4 L, r = 0.935, P < 0.001). For ECW assessments, the larger difference was in women (1.6 L, r = 0.993, P < 0.001). For ICW assessments, the larger difference was in men (3.9 L, r = 0.857, P < 0.001). For ECW/ICW ratios, the larger difference was in men (0.11, r = 0.793, P < 0.001).
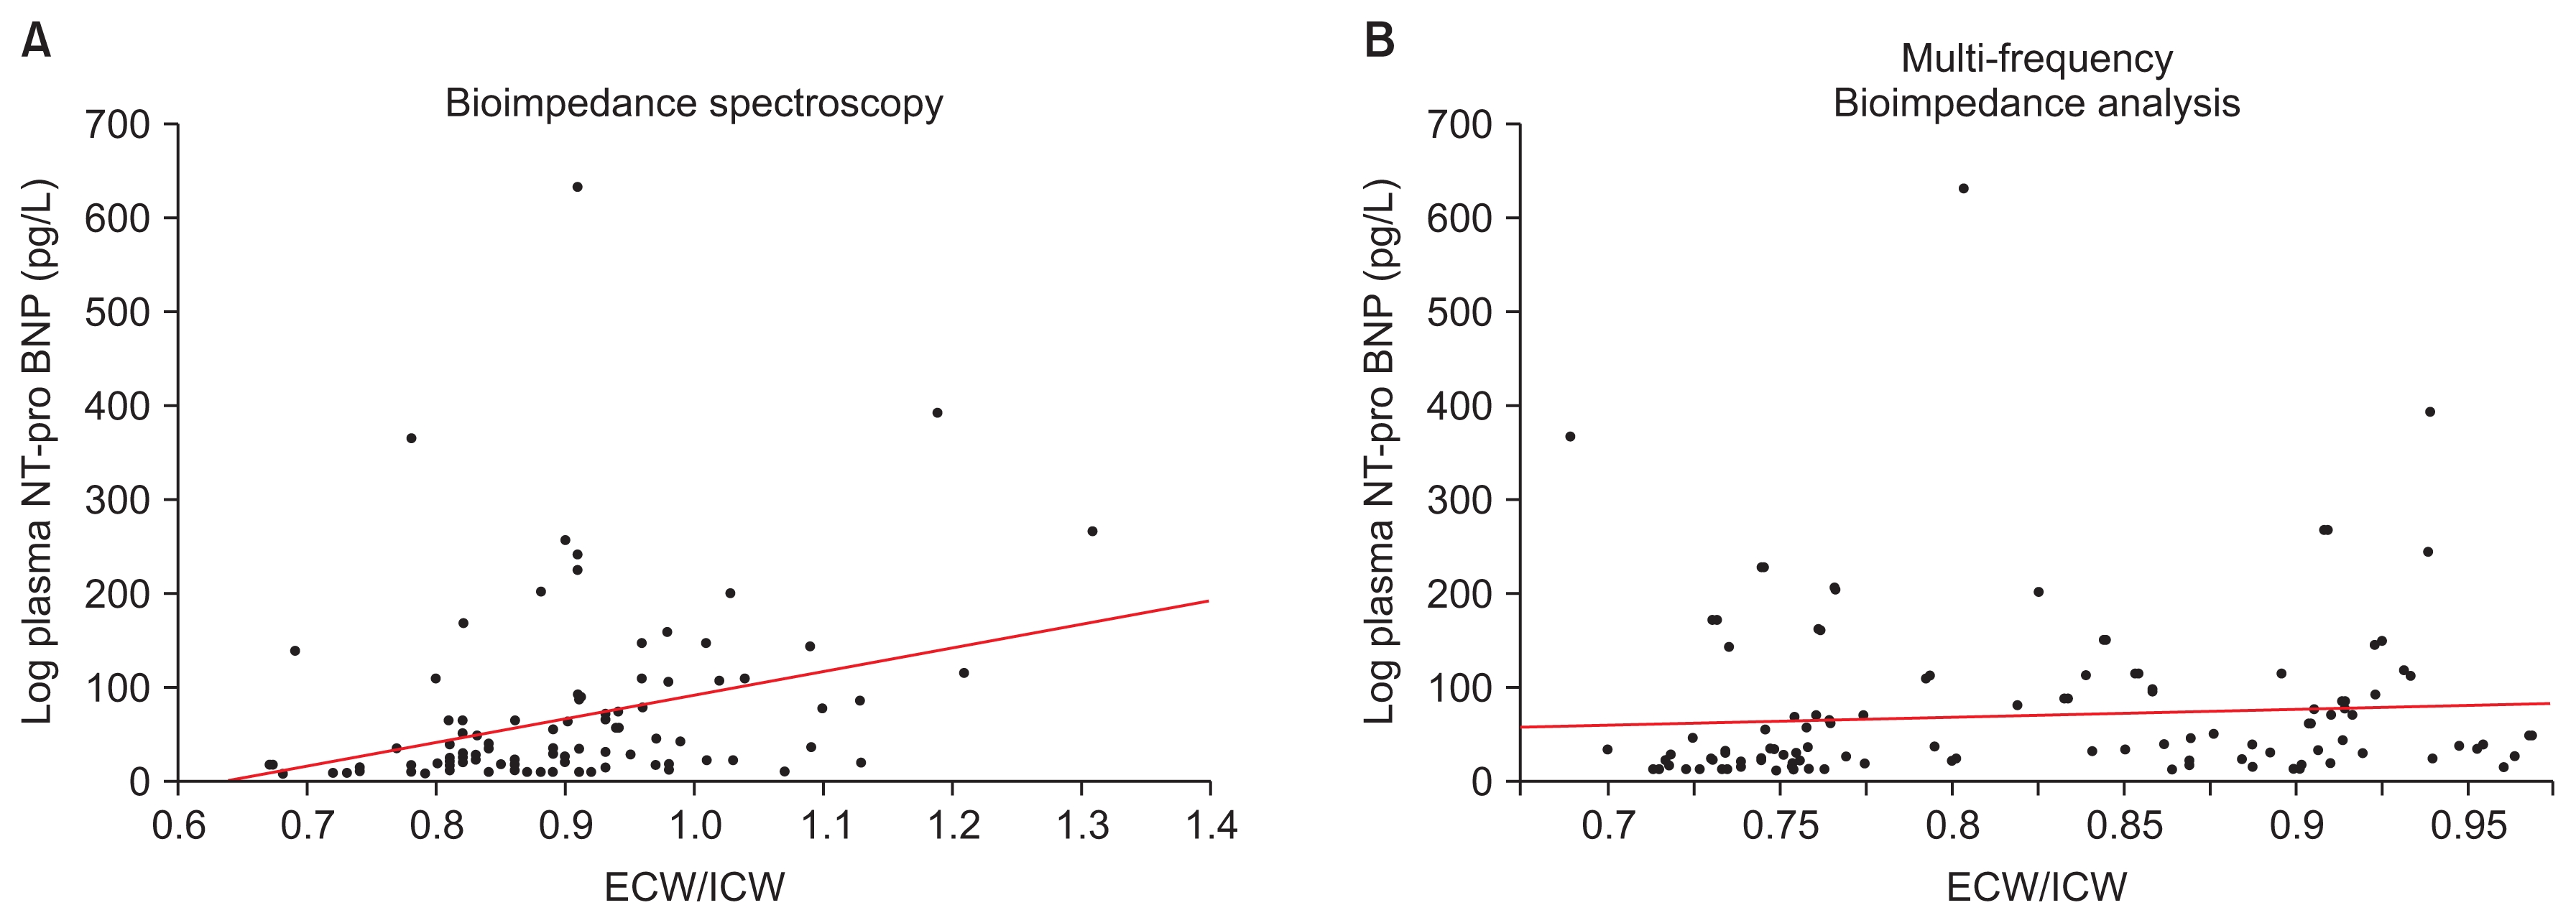
Log plasma NT-proBNP was associated with the ratio of ECW/ICW obtained by BIS (log plasma NT-proBNP = ŌłÆ153.88 + 248.60 ├Ś ECW/ICW, P = 0.003) (Fig. 1). TBW and ECW measured by BIS and BIA, and ECW/ICW obtained by BIA were not associated with log plasma NT-proBNP. SBP was associated with the ratio of ECW/ICW measured by BIS (SBP = 89.54 + 53.39 ├Ś ECW/ICW, P < 0.001) (Fig. 2). DBP was associated with log ECW/ICW evaluated by BIA (DBP = 102.52 ŌłÆ 35.28 ├Ś ECW/ICW, P = 0.004). TBW and ECW measured by BIS or BIA were not associated with SBP or DBP.
Body fat and lean mass assessments
Overall lean mass assessments using BIA gave higher values than did BIS (11.1 kg, P < 0.001) (Table 3). The largest difference was in patients with a BMI > 30 kg/m2 (15.9 kg, P < 0.001). Overall fat mass assessments using BIS gave higher values than did BIA (2.1 kg, P < 0.001) (Table 3). The largest difference was in men (3.6 kg, P < 0.001).
Overall, % BF assessments using BIS produced higher values than did BIA (2.6%, P < 0.001) (Table 3). The largest difference was in men (4.4%, P < 0.001). Overall, body cell mass assessments using BIA gave higher values than BIS (9.9, P < 0.001) (Table 3). The largest difference was in patients with a BMI > 30 kg/m2 (12.8, P < 0.001). BIA assessments were highly correlated with BIS.
Within eGFR categories, BIA produced higher values for lean mass and body cell mass assessments. BIS produced higher values for fat mass and % BF assessments. For lean fat assessments, the largest difference was in patients with an eGFR < 30 mL/min/1.73 m2 (12.2 kg, r = 0.906, P < 0.001) (Table 3). The least difference was in patients with an eGFR > 60 mL/min/1.73 m2 (11.4kg, r = 0.871, P < 0.001). For fat mass assessments, the largest difference was in patients with an eGFR of 30 to 60 (3.4 kg, r = 0.884, P < 0.001) (Table 3). The least difference was in patients with an eGFR < 30 mL/min/1.73 m2 (2.5 kg, r = 0.954, P < 0.001). For % BF assessments, the largest difference was in patients with an eGFR > 60 mL/min/1.73 m2 (4.4%, r = 0.895, P < 0.001) (Table 3). The least difference was in patients with an eGFR < 30 mL/min/1.73 m2 (3.3%, r = 0.948, P < 0.001). For body cell mass, the largest difference was in patients with an eGFR < 30 mL/min/1.73 m2 (10.6 kg, r = 0.891, P < 0.001) (Table 3). The least difference was in patients with an eGFR > 60 mL/min/1.73 m2 (8.7 kg, r = 0.828, P < 0.001).
Within BMI categories, BIA produced higher values for lean mass and body cell mass assessments. BIS gave higher values for fat mass and % BF assessments. For lean mass assessments, the largest difference was in patients with a BMI > 30 kg/m2 (15.9 kg, r = 0.938, P < 0.001) (Table 3). The least difference was in patients with a BMI < 25 kg/m2 (7.9 kg, r = 0.902, P < 0.001). For fat mass assessments, the largest difference was in patients with a BMI > 30 kg/m2 (3.9 kg, r = 0.806, P < 0.001) (Table 3). The least difference was in patients with a BMI < 25 kg/m2 (2.1 kg, r = 0.811, P < 0.001). For % BF assessments, the largest difference was in patients with a BMI of 25.0 to 30.0 kg/m2 (4.8%, r = 0.890, P < 0.001) (Table 3). The least difference was in patients with a BMI < 25 kg/m2 (3.4%, r = 0.868, P < 0.001). For body cell mass assessments, the largest difference was in patients with a BMI > 30 kg/m2 (12.8 kg, r = 0.911, P < 0.001) (Table 3). The least difference was in patients with a BMI < 25 kg/m2 (7.4 kg, r = 0.873, P < 0.001).
For both Chinese and non-Chinese, BIA resulted in higher values for lean mass and body cell mass assessments. Conversely, BIS resulted in higher values for fat mass and % BF assessments. For lean mass assessments, the larger difference was in Chinese (11.7 kg, r = 0.883, P < 0.001) (Table 3). For fat mass assessments, the larger difference was in Chinese (3.2 kg, r = 0.892, P < 0.001) (Table 3). For % BF assessments, the larger difference was in Chinese (4.3%, r = 0.855, P < 0.001) (Table 3). For body cell mass assessments, the larger difference was in non-Chinese (9.8 kg, r = 0.873, P < 0.001) (Table 3).
Between men and women, BIA resulted in higher values for lean mass and body cell mass assessments. BIS resulted in higher values for fat mass and %BF assessments. Men had larger differences for lean mass assessments (12.9 kg, r = 0.702, P < 0.001) (Table 3), fat mass assessments (4.2 kg, r = 0.921, P < 0.001) (Table 3), % BF assessments (5.4 kg, r = 0.921, P < 0.001) (Table 3) and body cell mass assessments (10.4 kg, r = 0.686, P < 0.001) (Table 3).
Waist circumference was associated with fat mass assessments in both BIS (waist circumference = 69.97 + 0.97 ├Ś fat mass, P < 0.001) and BIA (waist circumference = 73.81 + 0.89 ├Ś fat mass, P < 0.001). Skin-fold thickness was also associated with fat mass assessments in both BIS (skin-fold thickness = 1.58 + 0.07 ├Ś fat mass, P < 0.001) and BIA (skin-fold thickness = 1.79 + 0.06 ├Ś fat mass, P < 0.001). Fat mass assessments were not associated with waist-to-hip ratio. Serum prealbumin was associated with lean mass measurement in BIS (prealbumin = 25.50 + 0.13 ├Ś lean mass, P = 0.020) but not with lean mass evaluated in BIA. SGA scores were also only associated with lean mass by BIS (ŌłÆlog likelihood 2.667, chi-square = 5.334, P = 0.0209). Conversely, MAMC was associated with lean mass in both BIS (MAMC = 11.700 + 0.034 ├Ś lean mass, P = 0.0049) and BIA (MAMC = 11.451 + 0.0305 ├Ś lean mass, P = 0.0036).
Discussion
Our results showed clinically significant biases in body composition assessments in BIA and BIS using the FBCM and the BQ400. On average, BIA recorded higher readings for TBW, ECW, ICW, and lean mass but lower values for fat mass and % BF. Subgroup analyses of the study population were carried out to delineate the biases based on specific patient profiles. The biases varied with ethnicity, sex, BMI, and eGFR.
Body composition assessment is required in pre-dialysis patients to assess nutrition and change in fluid status. In an earlier study, we showed that pre-dialysis CKD patients have poorly controlled hypertension despite being treated in an academic medical center [19]. Furthermore, National Kidney Foundation clinical practice guidelines recommend nutritional assessment in CKD and end-stage kidney disease to maintain adequate muscle mass [16]. Bioimpedance techniques allow clinicians to accurately assess a patientŌĆÖs body composition. Patients who have a high ECW and are hypertensive can be treated with sodium restriction and anti-hypertensives [20]. Moreover, patients with declining muscle mass can be prescribed protein supplements and exercise therapies [16,20].
Differences in body water and lean mass assessments were greatest in patients with an eGFR < 30 mL/min/1.73 m2. In CKD patients, we are usually interested in the distribution of body water as a higher ratio of ECW/ICW suggests fluid overload [21]. Objective assessments of lean fat mass are also important. In earlier stages, higher adiposity may be associated with metabolic syndrome, and thus detrimental to kidney function. In advanced CKD, adequate lean mass and body fat may be protective against infections and mortality during the transition to end-stage kidney disease and the initiation of dialysis [13,14,22ŌĆō24].
The various body water assessments differed in our study. For TBW, the largest differences recorded were in men and in patients with an eGFR < 30 mL/min/1.73 m2, a BMI between 25.0 to 30.0 kg/m2, or Chinese ethnicity. In ECW, the largest differences recorded were in women and patients with an eGFR < 30 mL/min/1.73 m2, a BMI < 25 kg/m2, or non-Chinese ethnicity. These factors resulted in higher BIS-determined ECW/ICW ratios, especially in patients with an eGFR of 30 to 60 mL/min/1.73 m2, a BMI > 30 kg/m2, or non-Chinese ethnicity, and in men. ECW had the highest correlation (r = 0.994) followed by TBW (r = 0.970), ICW, (r = 0.926), and ECW/ICW ratio (r = 0.499). These findings suggest that these biases must be borne in mind when using BQ4000 BIA analyses of body water distribution to manage fluid overload, and that the resulting assessments are not equivalent to those of FBCM BIS. Regardless of the absolute numerical values, correlation with outcomes during clinical intervention is required for practical application.
The FBCM BIS ECW/ICW ratios appear to be more valid in their correlation with elevated SBP and plasma NT-proBNP, both of which are indicative of fluid overload and expanded intravascular volume [25ŌĆō27]. While BIA ECW/ICW ratios were correlated with DBP and not SBP, the limitations of DBP as a reliable hypertensive factor in clinical outcomes have been reported extensively [28ŌĆō30]. SBP rises with age, while DBP tends to fall in patients > 50 years old [28]. Furthermore, reduction of SBP has been shown to be a better predictor of cardiovascular events and thus has become the primary target of anti-hypertensive therapy [30].
In assessing lean mass, the largest differences recorded were in men, non-Chinese, or those with an eGFR < 30 mL/min/1.73 m2 or BMI > 30 kg/m2. The highest correlation was in fat mass (r = 0.982), followed by lean mass (r = 0.981), body cell mass (r = 0.941), and % BF (r = 0.931). The reported biases are likely to be inherent in the methods used in both instruments. In developing the FBCM BIS, the derivation population included CKD patients, whereas BQ4000 BIA may not have adequate representation. Because no derivation equations within these machines were made using reference methods in Asians, no adjustment factors were available; the equations within the machines are proprietary. Other factors, including the number of frequencies employed and the mathematical models assumed in estimating body compartments, may affect the estimates. The FBCM BIS uses 50 frequencies that range from 5 to 1,000 kHz. The BQ4000 BIA assesses body composition using only four impedance values: 5, 50, 100, and 200 kHz.
Bioimpedance methods have been validated against reference standards [15,18]. In a population of 36 healthy males, ECW and TBW measured with BIA with reference radioisotope dilution methods had a high correlation of r = 0.930 and r = 0.947, respectively [31]. However, overestimation of TBW and ECW using BIA in obese people has also been reported [32]. These results are similar to our study of stable CKD patients. Furthermore, our results showed that BIS and BIA were associated with skin-fold thickness in pre-dialysis CKD patients although skin-fold thickness has been reported to be more reliable than BIS for fat assessment [33]. BIA is widely used in many centers [15]. Also, selection of a specific bioimpedance method has yet to become universal for CKD patients. While our study did not prove which method was more accurate, it emphasized the importance of knowing the relative bias of measurements obtained in patients with pre-dialysis CKD. Furthermore, the information derived from BIS and BIA is not directly interchangeable. It is important for clinicians to safely and correctly interpret and apply the measurements obtained from various instruments in their clinical practices. Regardless of the bioimpedance method used, clinical correlation is essential.
This study has a number of limitations. First, the majority of patients had a BMI > 25 kg/m2, which may have skewed the results. Second, body composition (muscle and fat) may have been influenced by ethnicity as we had fewer non-Chinese patients. Third, our study did not compare bioimpedance measurements to values obtained by reference methods for assessing body water distribution, body muscle, and fat composition. However, the aim of this study was to determine the degree of biases within both methods of bioimpedance. Fourth, the BIS machine had been validated for managing fluid volume in dialysis patients. Most of the patients in this study were stable, non-dialysis CKD patients who underwent a cross-sectional assessment of body composition with no clinical intervention to assess the veracity of the bioimpedance measures longitudinally.
In conclusion, this study showed that biases exist when using either the FBCM BIS or the BQ4000 BIA. Ethnicity, sex, BMI, and eGFR contributed to the differences. FBCM BIS volume assessments of fluid overload appear to be more strongly associated with biochemical and clinical indicators.

 PDF Links
 PubReader
 Full text via DOI
 Download Citation
 Print
Print


")


