


Introduction
Chronic kidney disease (CKD) and end-stage renal disease (ESRD) are becoming more prevalent globally. Management of the common symptoms and complications experienced by patients with CKD and ESRD is important for physicians.
Compared to the general population, patients with CKD and ESRD have more gastrointestinal symptoms. Specifically, patients with ESRD have a higher incidence of gastrointestinal distress symptoms and peptic ulcers [1]. The recurrence of peptic ulcer disease (PUD) after Helicobacter pylori eradication is higher in uremic patients than in non-uremic patients, and patients with ESRD have higher complication rates after ulcer development [2]. A recent nationwide population-based study in Taiwan revealed that the incidence of PUD in patients with CKD increased from 13.2 to 19.8 per 1,000 persons/year over 10 years. This increase was 10 to 12 times higher than in patients without CKD [3]. In light of these statistics, clarifying the higher risk in patients with PUD and performing early endoscopy are crucial in patients with ESRD. The risk factors of PUD, however, in ESRD patients are poorly understood. There are few data about risk stratification of peptic ulcers in patients with ESRD [4]. Describing the potential risk factors and modifying patient management could reduce the incidence of PUD, and in turn reduce the occurrence of peptic ulcer bleeding. This study aims to determine which risk factors are associated with the occurrence of PUD in patients with ESRD.
Methods
Study population and design
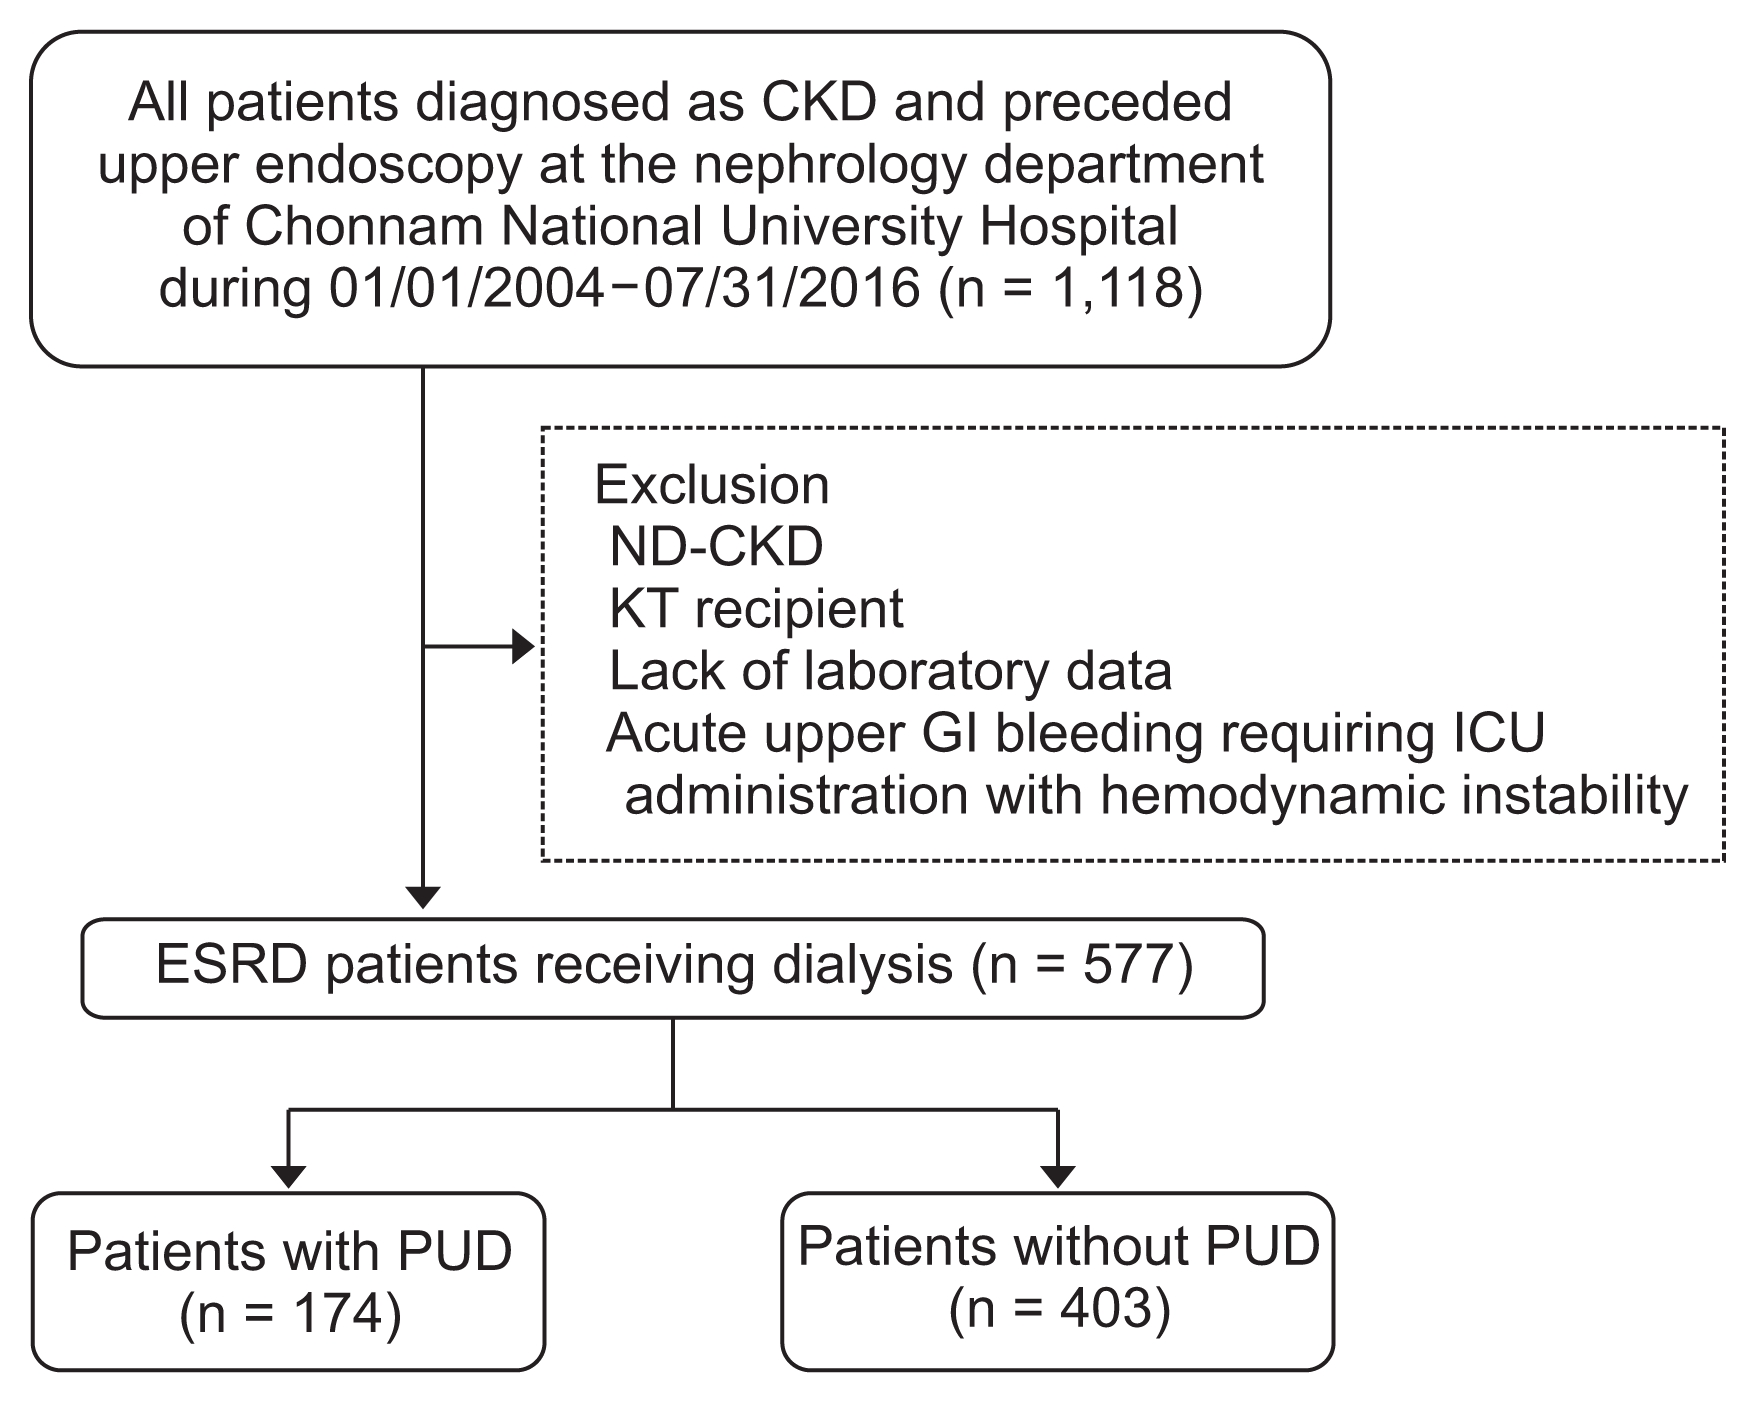
Consecutive stable dialysis patients who were at Chonnam National University Hospital in Korea between 2004 and 2016 were enrolled in this retrospective study. We only included ESRD patients who underwent endoscopy. For risk factor identification, we excluded patients with decompensated liver cirrhosis and gastrointestinal or hematologic malignancy. Furthermore, we excluded patients with life-threatening conditions, such as acute upper gastrointestinal bleeding or hypovolemic shock due to bleeding. Ultimately, the study included 577 ESRD patients who underwent upper endoscopy owing to non-life-threatening conditions (Fig. 1). This study was approved by the Institutional Review Board (IRB) of Chonnam National University Hospital (IRB no. CNUH-2016-202).
Data collection and definitions
Demographic, clinical, and laboratory data were collected from the patientsŌĆÖ medical records. These data included age; sex; body mass index; history of hypertension, diabetes mellitus, coronary artery disease, and dyslipidemia; smoking and alcohol consumption status; levels of serum creatinine, liver enzymes, total protein, and albumin; liver profile; and medication history, such as non-steroidal anti-inflammatory drug (NSAIDs) and aspirin use. All laboratory findings were collected within one month before endoscopic examination. Patient medication history was reviewed 3 months before endoscopic examination. In this study, the use of NSAIDs or aspirin for less than one week was not considered drug use. Additionally, we collected data about dialysis vintage, duration, and vascular access at the time of endoscopic examination.
Patients with epigastric pain, gastrointestinal distress, dyspepsia, gastric regurgitation, or other ambiguous gastrointestinal symptoms were encouraged to undergo endoscopy. The diagnosis of PUD was made on the basis of positive endoscopic findings.
Data analysis
We used the Statistical Package for the Social Sciences (SPSS) ver. 21.0 for Microsoft Windows (IBM Corp., Armonk, NY, USA) for all statistical analyses. All numerical variables (e.g., age, laboratory data) were represented as mean value ┬▒ standard deviation, whereas all categorical variables were represented as numbers and percentages. Comparisons between groups were performed using independent-sample t tests for numerical variables and the chi-square test or FisherŌĆÖs exact test for categorical variables. Multiple logistic regression analysis was performed after controlling for factors that showed significant differences at baseline between the 2 groups to determine whether those factors influenced clinical end points. All tests were two-tailed and variables with P values less than 0.05 were considered statistically significant.
Results
Of the 577 patients with ESRD included in this study, 174 patients (29.6%) were diagnosed as having PUD (gastric or duodenal ulcer) by endoscopy. Clinical parameters of study patients are summarized in Table 1. Patients on hemodialysis had a higher prevalence of PUD than those on peritoneal dialysis. There was no significant difference in the average age between the two groups. In a previous paper, age was considered to be a risk factor for PUD in ESRD patients [5]. The management of complications in elderly patients is especially important due to the increase in the number of elderly patients on dialysis. In our study, age over 70 years was found to be a risk factor for PUD in ESRD patients. The prevalence of hypertension, diabetes mellitus, coronary artery disease, smoking, and alcohol history did not differ between the two groups. Blood pressure (systolic and diastolic) was lower in patients with PUD than those without PUD. Body mass index did not differ between the groups. Compared to patients without PUD, those with PUD had a lower serum albumin level and higher blood urea nitrogen (BUN) level. The low-density lipoprotein cholesterol level was also lower in patients with PUD than in those without PUD (Table 1).
Baseline characteristics for patients according to ulcer location are shown in Supplementary Table 1. Of the 577 patients, 256 patients underwent endoscopic biopsy. Biopsy results are described in Supplementary Table 2. Three patients were diagnosed with adenocarcinoma of the stomach, 1 patient was diagnosed with squamous cell carcinoma of the esophagus, and 4 patients were diagnosed with low grade dysplasia of the stomach. H. pylori testing was done in 101 of the 577 patients.
Mean dialysis vintage of enrolled patients was 2.9 years. A total of 454 patients were receiving hemodialysis and 123 patients were on peritoneal dialysis. PatientsŌĆÖ baseline characteristics according to the two dialysis modalities are described in Table 2. Mean dialysis vintage showed no difference between the groups. Hemodialysis patients were older and more likely to take aspirin and NSAIDs. Combined comorbidities did not differ between the groups. The prevalence of gastric ulcers was significantly higher in hemodialysis patients and there was no difference in terms of the occurrence of duodenal ulcers. Among the 454 hemodialysis patients, 256 were receiving hemodialysis via an arteriovenous fistula, 19 patients were receiving hemodialysis via an arteriovenous graft, and 179 patients received hemodialysis through a catheter. For these three groups, PUD occurred in 84, 3, and 62 patients, respectively, with no statistically significant difference in prevalence.
We classified each nutritional index according to the criteria of well-known nutritional deficiencies in patients on dialysis and analyzed their association with PUD. We found that the average albumin level was less than 3.8 mg/dL, serum creatinine level was less than 6.0 mg/dL, uric acid level was less than 5.0 mg/dL, and total cholesterol level was less than 140 mg/dL. Except for the serum creatinine level, serum albumin, uric acid, and total cholesterol levels were lower than the criteria associated with PUD in patients with ESRD (Table 3).
Results of the multivariate analysis of risk factors for the occurrence of PUD in patients with ESRD are shown in Table 4. Hemodialysis was the strongest risk factor for the occurrence of PUD in ESRD patients, with an adjusted hazard ratio (HR) of 2.178 (95% confidence interval [CI], 1.302ŌĆō3.636), followed by hypoalbuminemia with an adjusted HR of 1.754 (95% CI, 1.274ŌĆō2.410). When including the positive number of malnutrition indexes in analysis, two or more malnutrition indices were found to be strongly associated with the occurrence of PUD in ESRD patients, with an adjusted HR of 2.137 (95% CI, 1.300ŌĆō3.511). Higher BUN levels were associated with an increased risk of PUD with an adjusted HR of 1.004 (95% CI, 0.998ŌĆō1.009) (Table 4).
Discussion
In this study, 30.2% of patients with ESRD had endoscopically diagnosed PUD, which is somewhat higher than the prevalence reported in previous studies [2,6]. In another study in Taiwan [4], 18.5% of 827 dialysis patients with no prior history of peptic ulcers were diagnosed with new onset peptic ulcers. Variation in the percentage of patients with PUD is likely due to different methodologies used in data collection and analysis. Even if a discrepancy of prevalence in patients with ESRD exists, the present study reconfirmed that the prevalence of PUD in patients with ESRD is much higher than that in the general population.
We used serum markers that could be easily and routinely checked at the dialysis center such as serum albumin, creatinine, uric acid, and total cholesterol. Serum albumin level is a well-known nutritional index in patients with ESRD [7,8]. Park et al [9] and Walther et al [10] reported that lower creatinine level is associated with higher mortality in dialysis patients. In a recent study, a low uric acid level (< 5.0 mg/dL) was associated with higher mortality in dialysis patients [11]. Similarly, hypocholesterolemia (< 140 mg/dL) was associated with higher mortality in hemodialysis patients [12]. The current study indicated that hemodialysis and hypoalbuminemia were associated with PUD. In previous studies, low serum albumin levels were thought to be predictive of CKD and associated with the high mortality in patients with ESRD [7,8].
Patients on dialysis often have a nutritional problem. In 2009, the International Society of Renal Nutrition and Metabolism recommended the terminology protein-energy wasting syndrome to describe the nutritional issue in patients with ESRD [13]. Malnutrition in ESRD is associated with chronic inflammation and higher mortality [14,15]. To reduce the morbidity and mortality associated with malnutrition, assessing patientsŌĆÖ nutritional status should be a routine part of the care of patients with ESRD, but the diagnostic criteria and laboratory parameters are still controversial. Previous well-known diagnostic criteria, such as the International Society of Renal Nutrition and Metabolism criteria, or subjective goal assessment and French protein-energy wasting score, are composed of multiple factors, subjective symptoms, and laboratory findings [13,16,17]. It is not easy to use all the nutritional assessment tools in these assessments in a clinical setting. Thus, we defined simple laboratory findings that could be easily used in a dialysis center and analyzed their association with PUD. The nutritional factors that can easily be measured and interpreted in clinical settings included in this study are serum albumin level less than 3.8 mg/dL, total cholesterol level less than 140 mg/dL, uric acid level less than 5 mg/dL, and serum creatinine level less than 8 mg/dL. When using these nutritional indices, patients who met two or more of these thresholds had a high prevalence of PUD. A low serum albumin level is considered to reflect diminished visceral protein stores, protein malnutrition, and inflammation. Proposed mechanisms for the association of malnutrition and inflammation in CKD include appetite suppression and enhanced protein catabolism by proinflammatory cytokines [8]. Both inflammatory stress and malnutrition might impair function of the gastric mucosa and induce development of a peptic ulcer.
BUN levels were higher in PUD patients in this study. Malnourished patients often show a gradual reduction in BUN and low predialysis BUN levels have been associated with increased mortality [18]. However, protein nitrogen appearance (PNA) rather than a single measurement of BUN is more widely used as a nutritional indicator in dialysis patients. These conflicting data as an indicator of malnutrition could not be fully explained in this study. Therefore, it is difficult to assume that a single BUN measurement implies malnutrition. Further prospective studies conducting a risk assessment of BUN and PNA levels with PUD are required.
Although patients on peritoneal dialysis have a higher risk of PUD than the general population, recent studies have shown that patients on hemodialysis are at an even higher risk of PUD [19]. As reported in previous studies, we report that the prevalence of PUD was higher in patients on hemodialysis. Furthermore, patients on hemodialysis were more likely to have gastric ulcers and all patients with gastric and duodenal ulcers were undergoing hemodialysis. The potential reason why patients on hemodialysis showed a higher prevalence of PUD may be explained by multiple factors. First, anticoagulant use during hemodialysis may contribute to risk [4,5,20]. Second, intradialytic hypotension and hemodynamic changes might play a role in the occurrence of PUD. Intradialytic hypotension occurs in about 20% to 30% of hemodialysis sessions and it remains one of the most common problems of hemodialysis [21]. Third, the characteristics of patients on peritoneal dialysis and those on hemodialysis may differ. Compared with patients on hemodialysis, those on peritoneal dialysis tend to be younger, more highly educated, and subject to fewer morbidities [22]. In addition, compared to patients undergoing peritoneal dialysis, those undergoing hemodialysis are more exposed to inflammatory conditions and oxidative stress, which can damage or exacerbate the stomach or small intestinal mucosa [23].
In the present study, the H. pylori test (CLO test) was performed in 101 patients (87 patients with PUD and 14 patients without PUD). Because there were 88 patients that did not undergo the H. pylori test, it was not possible to analyze the relationship between H. pylori infection and PUD in our study. In the general population, H. pylori infection is strongly associated with the development of peptic ulcers, but a recent study has reported that this association is weak in ESRD patients [24,25]. Some studies insist that H. pylori infection may not play a central role in the occurrence of peptic ulcers in dialysis patients. Moreover, the H. pylori infection rate is significantly lower in ESRD patients compared to the general population, and the eradication of H. pylori did not affect ulcer recurrence rate in ESRD patients [4]. In a 2-year prospective observational study, peptic ulcer recurrence after H. pylori eradication was shown to be higher in ESRD patients than in patients without renal disease. Moreover, Tseng and Lin [25] speculated that factors aside from H. pylori infection may play an important role in peptic ulcer recurrence in ESRD patients.
Other well-known risk factors for PUD in the general population, such as use of aspirin, NSAIDs and antiplatelet agents, have still not been proven to be risk factors for peptic ulcers in ESRD patients. In a retrospective study of 827 incident hemodialysis patients, use of NSAIDs and aspirin were not identified as risk factors for PUD [4]. A large nationwide population-based study in Taiwan showed that the use of aspirin did not increase the risk for PUD in CKD patients. Although the use of NSAIDs was considered as a risk factor for PUD in non-dialytic CKD patients, the association of the use of NSAIDs and the occurrence of PUD in ESRD patients was not clearly established [3,20]. Adding to the previously published evidence, we did not find an association between PUD occurrence and the use of aspirin or NSAIDs in this study. Because of the limitations inherent in the retrospective design of this study, however, the use of aspirin and NSAIDs may not have been reported properly because we were unable to collect the prescribing information from other local clinics. Additionally, we did not collect data on prophylactic medications, such as proton pump inhibitors, which can counteract the effects of aspirin and NSAIDs. More large, prospective, randomized controlled trials are needed to determine the associations between PUD and the use of other medications.
The present study has several limitations. First, data was analyzed retrospectively. The non-randomized nature of the registry data could have resulted in selection bias. Although most potentially confounding variables were included in the multivariate analysis, it is possible that some potential biases were included. Second, because of the limitation inherent in the retrospective study design, data for patient medication history and underlying comorbidities, such as peripheral artery obstructive disease, osteoarthritis, and herniated nucleus pulposus could not be checked. Therefore, we could not identify the effect of other possible comorbidities and use of drugs such as antiplatelet and anticoagulant agents. In the same context, information of dialysis adequacy, residual renal function, and PNA could not be collected. Third, there is some variation in prior treatment and testing of patients that could lead to bias. For example, not all patients with ESRD underwent routine upper endoscopy, so the prevalence of PUD could be overestimated because of selection bias of symptomatic patients. Similarly, H. pylori testing was not performed in all patients. Fourth, the total number of enrolled patients was small, and this study was performed at a single center. As a result, our data do not represent all patients with ESRD. Therefore, large-scale, prospective randomized controlled, multi-center studies are needed to clarify the incidence and risk factors for PUD in ESRD patients. Despite the several aforementioned limitations, our study showed meaningful findings. Compared to data on peptic ulcer bleeding among patients with ESRD, there has been a lack of data about the risk factors for peptic ulcer in patients with non-bleeding PUD. Guardedly, we suggest that in ESRD patients, hypoalbuminemia and malnutrition indices could indicate the risks for PUD.
In conclusion, the prevalence of PUD was higher in patients with ESRD than in the general population. Hemodialysis, and hypoalbuminemia could be the risk factors of PUD among patients with ESRD. Two or more malnutrition factors were also associated with a higher risk of PUD in ESRD patients. Therefore, endoscopy should be performed in patients with these risk factors more often to prevent severe complications, such as gastrointestinal bleeding. Further prospective large-scale studies are required to confirm the association of malnutrition with PUD.
 PDF Links
 PubReader
 Full text via DOI
 Download Citation
 Supplement 1
 Print
Print


")


